In this guide 8
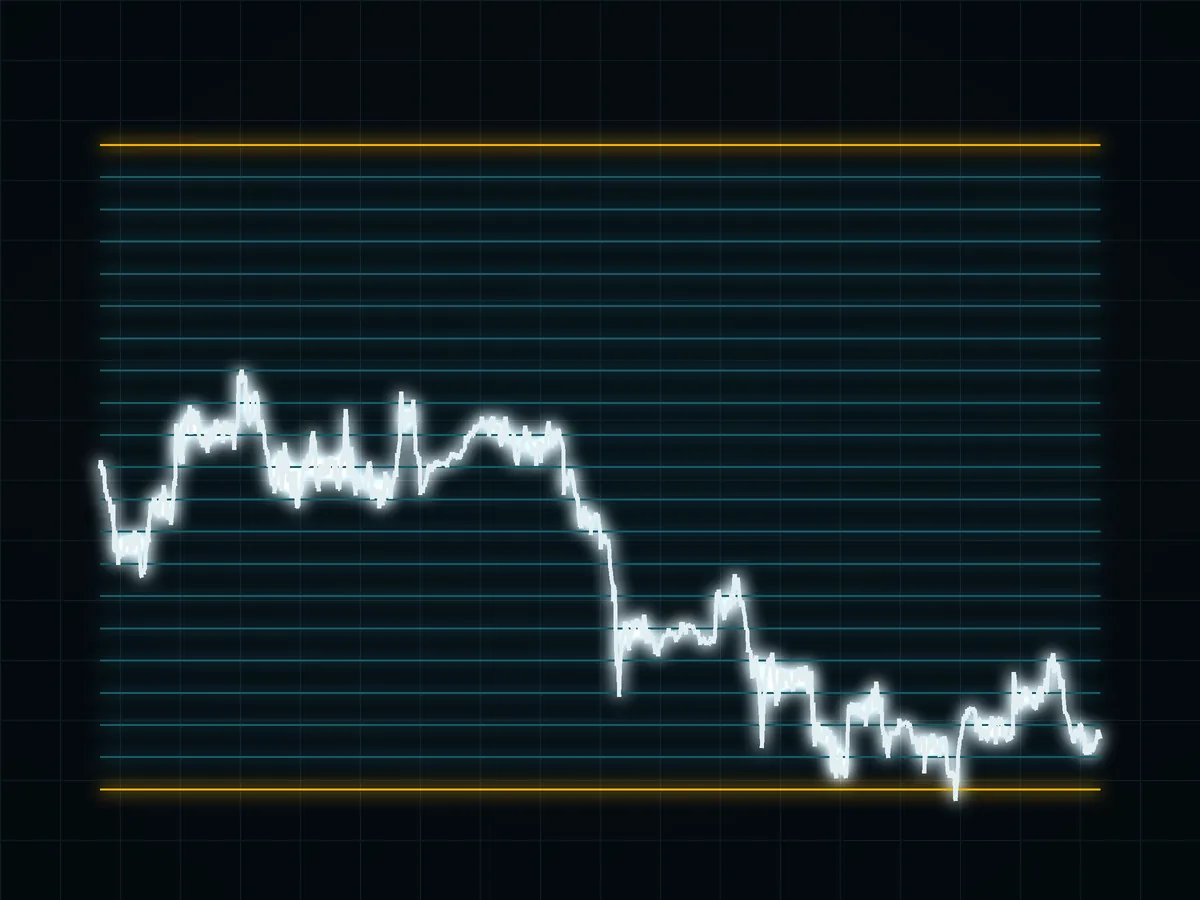
A grid trading bot places orders at fixed price levels inside a range. Below the current price it waits with buys. Above the price it waits with sells. When a bought lot is later sold one level higher, the bot records a completed grid cycle.
That mechanism does not turn volatility into certain profit. Total performance has two parts: cash from completed cycles and the current value of inventory that has not been sold. A positive "grid profit" line can sit beside a larger inventory loss.
01A transparent worked model#
Illustrative model: assume a token trades at $100, the range runs from $95 to $105, and 20 equal steps make each level $0.50 apart. The range width is $10. A $1,000 allocation is split into 20 lots of $50.
- A fall from $100 to $99.50 buys about one $50 lot.
- A return to $100 sells that lot.
- The gross token price move is $0.50.
- The net result must subtract both fills' fees, spread and any slippage.
For the model only, assume each fill costs 0.10% of notional, represented by a 0.001 fraction. On a $50 lot that is $0.05 per fill and $0.10 for 2 fills. The $0.50 price step is a 0.005 fraction of the $100 start, so the gross lot move is $0.25 and the net model income is $0.15. These are invented inputs, not a current venue tariff.
02Sideways path versus falling path#
Compare two hypothetical sequences. Both start at $100. Path A moves to $99.50 and back to $100 4 times. Path B completes 2 such cycles, then falls through $99, $98 and finally below $95.
| Invented path | Completed cycles | Approximate model income | Ending inventory |
|---|---|---|---|
| Four repeated crossings | 4 | $0.60 | Little net change |
| Two crossings, then below range | 2 | $0.30 | Several lots remain below cost |
Path A illustrates what the mechanism needs: repeated crossings with enough distance after costs. Path B explains the main failure mode. The bot can record completed income and still lose overall because it kept buying into a decline.
The model does not include queue priority, partial fills, changing spread or rejected orders. Order-book depth explains why a displayed level may not contain enough quantity for the expected fill.
03What happens outside the range#
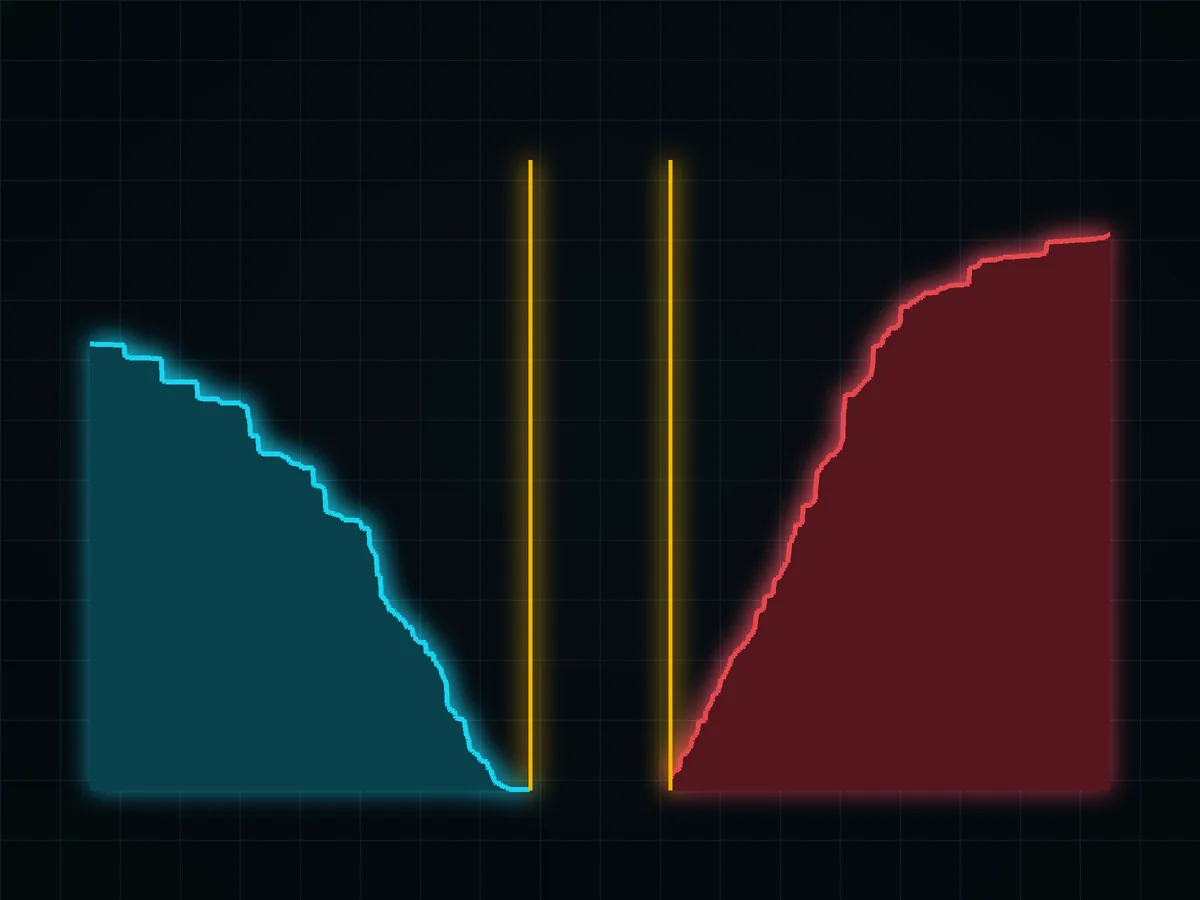
Below the lower boundary, a long spot grid has used much of its cash and holds inventory. It cannot keep buying indefinitely. Above the upper boundary, it has sold inventory and holds cash while price may continue rising.
A wider range lasts through a larger move but divides capital across more distant orders. A narrower range concentrates orders and can produce more crossings, but an ordinary move can break it sooner. Neither choice removes directional exposure.
04Grid count and actual costs#
More grid levels create smaller price steps. That can increase the number of possible cycles, but costs consume a larger share of each cycle. Fewer levels create wider steps and fewer opportunities.
Before entering numbers, check:
- the account's actual fee tier;
- whether each order is expected to rest or execute immediately;
- minimum order size and price increment;
- spread and visible depth near every level;
- the rule for cancelling or stopping outside the range.
A limit order is not automatically a maker order. If it crosses available quotes, some or all of it can be a taker fill. Read maker versus taker fees and verify the execution report rather than assuming a cheaper rate.
05Spot and futures grids are different#
A spot grid buys and sells the asset. A futures grid uses contracts and margin. It can add funding, borrowed exposure and liquidation risk. The venue's funding schedule and maintenance rules are product-specific and can change.
If a margined long grid keeps adding exposure as price falls, the position can move toward liquidation while the model continues to show pending sell levels. Compare the collateral mechanics in margin versus leverage before treating the two products as interchangeable.
06A pre-launch checklist#
- Write the range and the reason it represents a ranging market.
- Calculate the net step with conservative cost assumptions.
- Decide what happens below and above the range.
- Set a maximum inventory value and total loss threshold.
- Compare total account value, not only completed-cycle income.
- Test partial fills and gaps in a paper model before using capital.
A grid is an order-management rule, not an independent source of edge. The worked example shows its arithmetic and its boundary failure, but it does not claim a historical return.
07Sources#
Primary mechanics checked November 5, 2026: Coinbase trading rules for limit orders, maker and taker treatment, partial fills and price protection. All prices, paths and costs above are explicitly invented MODEL inputs.
FAQ#
How does a grid trading bot work?
Are grid bots profitable?
What happens when price leaves the range?
How many grid levels should I use?

DoberInvest on Telegram
Questions about this guide?Ask in the English channel. That is also where we post charts, the levels we watch and what would change our mind. A system, not signals, and no profit promises.
This guide explains how the mechanics work; what you do with them is your own decision. Trading can lose you money, and leverage makes losses bigger and faster. 18+

AI-assisted editorial model checked against the cited order rules; published by the DoberInvest editorial team, not as a claim of a real proprietary backtest.