
In this guide 8
Bollinger Bands
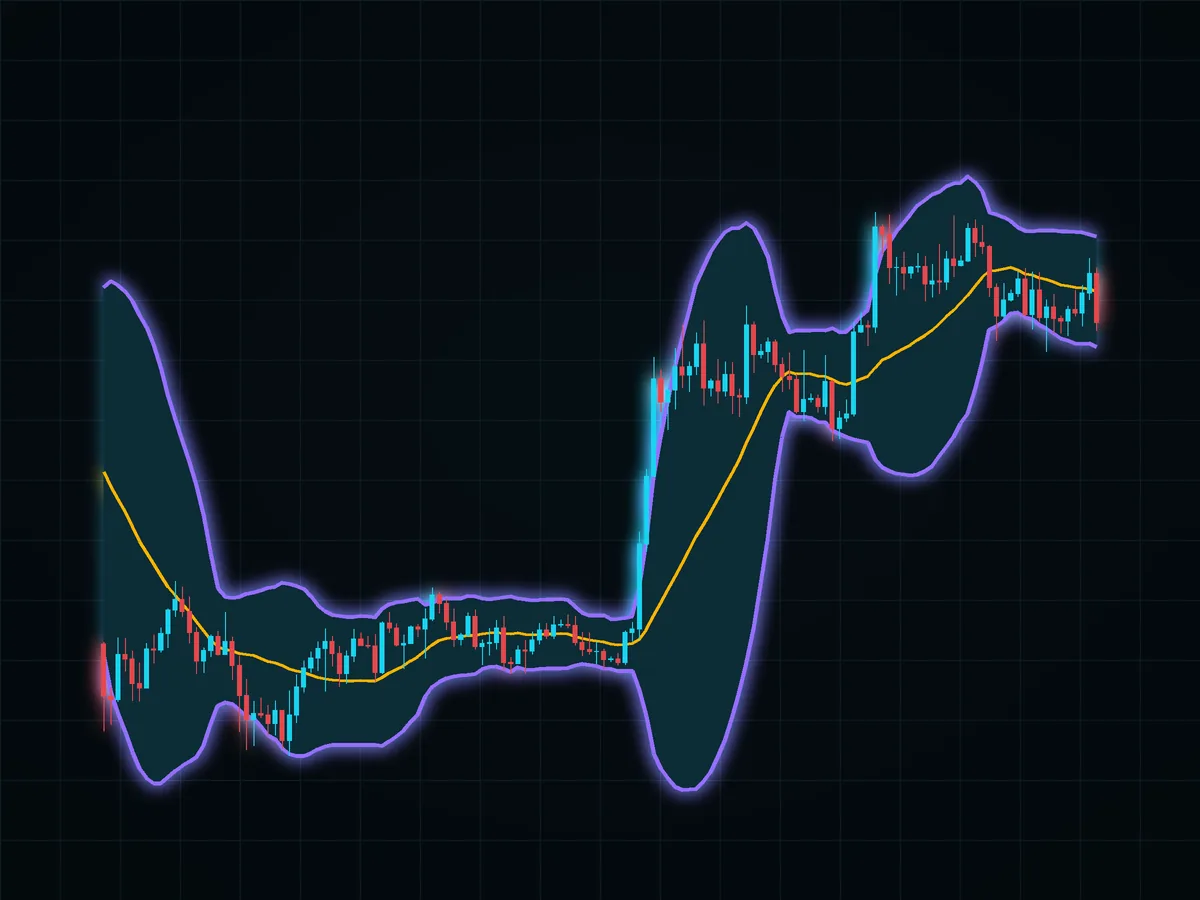
Bollinger Bands place an upper and lower envelope around a moving average. The distance from the average changes with recent price dispersion, so the bands expand when the calculated standard deviation rises and contract when it falls.
The indicator measures a relationship among past prices. A touch or close outside a band is not, by itself, a forecast of reversal or continuation.
01Standard formula#
TradingView's official documentation gives the common default as a 20-period simple moving average with bands two standard deviations away:
middle band = 20-period simple moving average
upper band = middle band + (2 × standard deviation)
lower band = middle band − (2 × standard deviation)
The period, price field, multiplier and standard-deviation convention must be consistent when results are compared.
02Worked band model#
Assume an invented band model with a 20-period simple moving average of 100, a standard deviation of 4, a deviation multiplier of 2, and a modeled close of 109. These are not current market readings.
The model inputs are:
- modeled 20-period simple moving average: 100;
- modeled standard deviation: 4;
- modeled deviation multiplier: 2.
The upper band is:
The modeled offset is 8 because 2 multiplied by 4 equals 8.
100 + (2 × 4) = 108
The lower band is:
100 − (2 × 4) = 92
The distance between the bands is 16.
One common normalized measure is bandwidth:
bandwidth = (upper band − lower band) ÷ middle band × 100
For this model:
(108 − 92) ÷ 100 × 100 = 16%
If a modeled close is 109, it is above the modeled upper band of 108. That statement follows from the arithmetic; it does not determine the next return.
03Worked quiet-period comparison#
Assume an invented quiet-period model with a middle band of 100, a multiplier of 2, and a standard deviation of 1:
upper band = 100 + (2 × 1) = 102
lower band = 100 − (2 × 1) = 98
quiet band width = 102 − 98 = 4
bandwidth = (102 − 98) ÷ 100 × 100 = 4%
The modeled bandwidth has narrowed from 16% to 4%. Traders may call a sufficiently narrow reading a squeeze, but “sufficiently narrow” requires a stated comparison rule, such as a percentile within a defined historical window.
The squeeze describes recent dispersion. It does not reveal whether a later move will be up or down.
04What a band touch means#
A price at the upper band is high relative to the selected moving average and standard deviation. A price at the lower band is low by the same definition. Neither condition supplies an automatic order.
In a persistent trend, prices can remain near one band. In a range, moves toward an outer band may reverse. Those are hypotheses to test, not properties assured by the formula.
05Why “95% inside the bands” is not a trading rule#
Two standard deviations are often associated with a normal-distribution interval, but market prices are time-dependent and need not be normally distributed. The moving mean and standard deviation also change from observation to observation. Do not convert the multiplier into a promised percentage of future closes inside the bands.
06A reproducible squeeze test#
To test a squeeze rule, define:
- instrument, venue and raw data source;
- timeframe, timezone and price field;
- moving-average period and deviation multiplier;
- standard-deviation convention;
- exact bandwidth formula;
- threshold or percentile window;
- entry, exit and direction rules;
- fees, spread and slippage;
- benchmark and out-of-sample period.
Retain the raw inputs and code. A table of final returns without those inputs cannot establish what happened.
07Sources#
Educational material, not investment advice. All numerical examples are invented models, not historical market observations.
FAQ#
How are Bollinger Bands calculated?
What does a Bollinger Band squeeze mean?
Is a close above the upper band an automatic sell order?
What settings are standard?

DoberInvest on Telegram
Questions about this guide?Ask in the English channel. That is also where we post charts, the levels we watch and what would change our mind. A system, not signals, and no profit promises.
This guide explains how the mechanics work; what you do with them is your own decision. Trading can lose you money, and leverage makes losses bigger and faster. 18+

Founder of DoberInvest, in the market since 2018. Teaches a system, not signals.