
In this guide 6
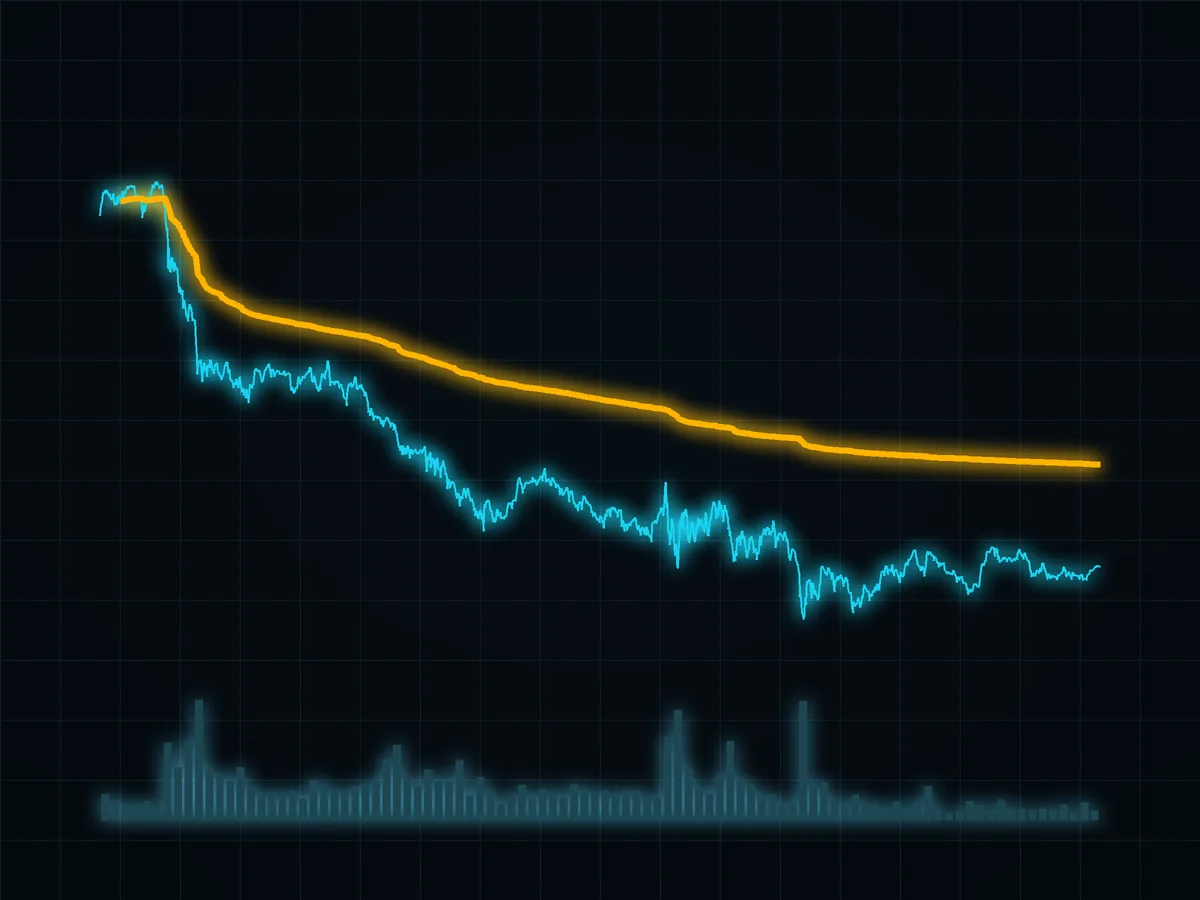
VWAP (volume-weighted average price) is the average traded price since a chosen session start or anchor, where each price counts in proportion to its volume. Above VWAP, current price is above that weighted average; below, it is below it. Trading desks use VWAP to compare execution with the market's weighted average, while chart users often treat it as intraday context.
01How VWAP is calculated#
For each bar in the session:
- Typical price = (high + low + close) ÷ 3.
- Multiply by the bar's volume.
- VWAP = sum of (typical price × volume) since the session start ÷ sum of volume since the session start.
Illustrative VWAP model: assume 1 BTC trades at $100 and 3 BTC trade at $110. Notional is $100 plus $330, or $430. Total volume is 4 BTC. VWAP is $430 divided by 4 BTC, or $107.50 per BTC.
The continuous-market problem. Crypto never closes, so a daily VWAP needs a provider-defined boundary. Check the chart setting before comparing values across venues. Near a fresh reset, little volume supports the line; later, more accumulated volume makes it slower to move. An anchored VWAP solves the boundary question differently: you pick the start event and it accumulates from there.
02What VWAP can and cannot tell you#
- It tells you the weighted average for the selected feed and anchor.
- It does not include volume from other venues unless the feed aggregates them.
- A cross does not predict continuation or reversal by itself.
- A different session boundary or anchor produces a different line without either calculation being wrong.
03How traders use VWAP#
- As a yardstick for your own fills. A fill below the selected feed's VWAP is below that feed's volume-weighted average for the stated boundary. It does not reveal every participant's cost basis.
- As a bias filter. Price holding above VWAP with higher lows: intraday buyers are in control, look for longs at pullbacks to it. Below: the reverse.
- As a pullback level. In a trend day, the first return to VWAP is a common place to look for an entry, with the stop on the other side.
- With bands. Some platforms draw deviation bands around VWAP, like Bollinger Bands. Treat them as context rather than automatic reversal levels.
- Anchored to an event. An anchored VWAP summarizes the selected feed's volume-weighted traded prices from the chosen event. It does not reveal every buyer's entry price or whether those buyers still hold a position.
VWAP and a volume profile answer related questions: VWAP gives the average price of the day, the profile shows at which prices the volume actually sat. Together they show whether the day's trading is accepting higher prices or rejecting them.
04Common mistakes#
- Using daily VWAP on a daily chart. It is an intraday tool; on higher timeframes use an anchored VWAP.
- Trusting VWAP in the first hour after the reset. Too little volume behind it.
- Treating every cross as a trade. A cross without structure or a plan is only a location update.
- Forgetting whose volume it is. Crypto trades on many venues at once, and a chart's VWAP uses the volume of the feed you opened. The worked calculation above uses invented inputs, not an exchange observation; a live value must name its feed and boundary.
- Fading a trend day back to VWAP. Price does not owe the weighted average a return.
- Forgetting costs. Repeated intraday entries can make fees dominate; check risk reward ratio and the mechanics in how to trade crypto futures.
VWAP is useful precisely because it answers a narrow question: the volume-weighted average price since a stated boundary. Keep the boundary and feed visible, then use structure and risk rules for the decision.
05Primary reference#
FAQ#
What does the VWAP indicator show?
How is VWAP calculated?
When does VWAP reset for crypto?
Is VWAP a good indicator?
What is the difference between VWAP and a moving average?

DoberInvest on Telegram
Questions about this guide?Ask in the English channel. That is also where we post charts, the levels we watch and what would change our mind. A system, not signals, and no profit promises.
This guide explains how the mechanics work; what you do with them is your own decision. Trading can lose you money, and leverage makes losses bigger and faster. 18+

Founder of DoberInvest, in the market since 2018. Teaches a system, not signals.