
In this guide 10
Risk reward ratio
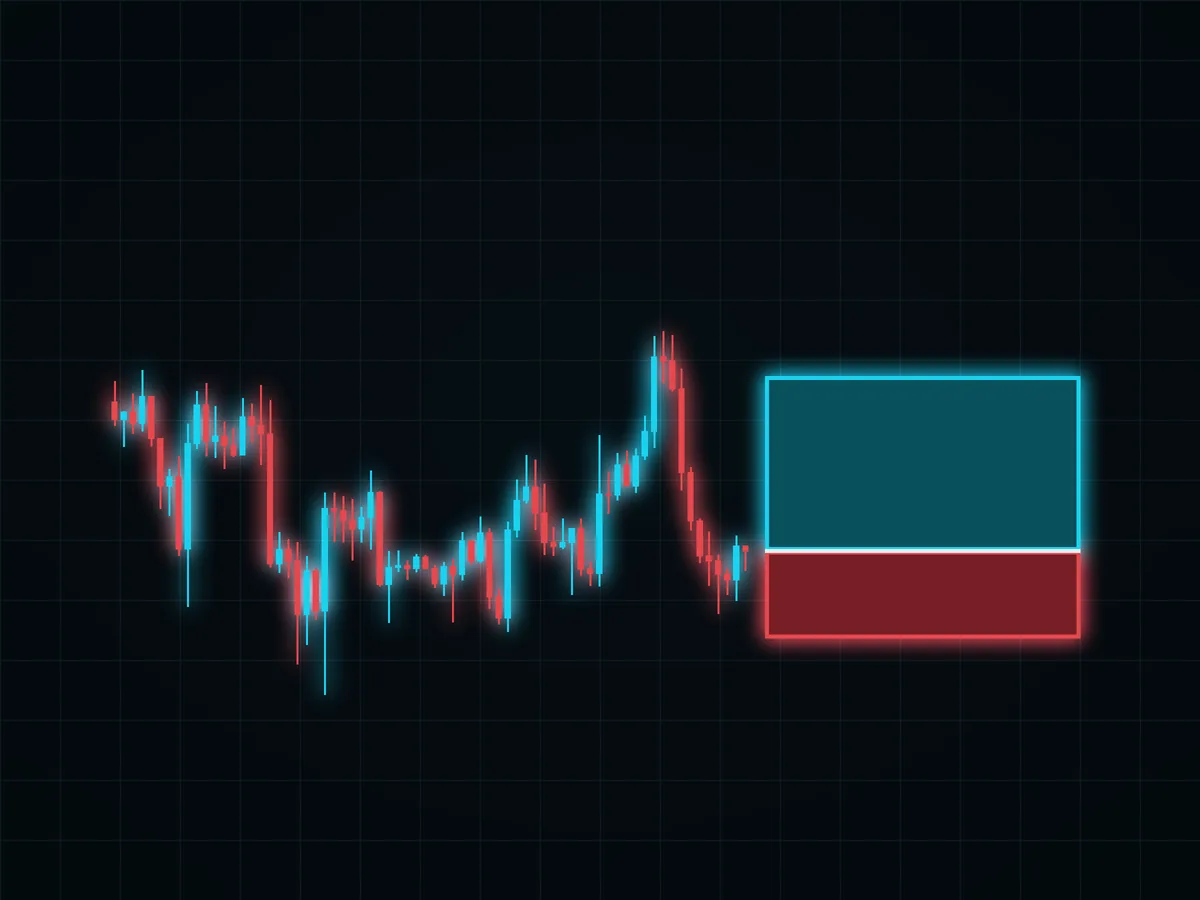
Risk reward ratio compares the amount a trade is planned to lose with the amount it is planned to make. It is a payoff description, not a probability estimate.
A large target can produce an attractive ratio on paper while being rarely reached. A complete evaluation therefore needs the ratio, the observed win rate under a fixed method, trading costs and enough trades to make the estimate meaningful.
01Formula#
For a long position:
risk = entry price − stop price
reward = target price − entry price
reward-to-risk multiple = reward ÷ risk
For a short position, reverse the subtractions. Traders often call the risk amount 1R. The symbol keeps differently sized trades comparable without implying a particular dollar budget.
02Worked price model#
Assume an invented model with entry at 100, stop at 96 and target at 108. These are not a live market setup.
The model inputs are:
- modeled entry: 100;
- modeled stop: 96;
- modeled target: 108.
The planned risk is:
100 − 96 = 4
The planned reward is:
108 − 100 = 8
The reward-to-risk multiple is:
8 ÷ 4 = 2R
That is commonly written as a 1:2 risk reward ratio: one unit at risk for two units of planned reward.
03Break-even win rate before costs#
If every loss is exactly 1R and every win is exactly 2R, the theoretical break-even win rate is:
1 ÷ (1 + 2) = 33.3%
The denominator in that model is 3 total payoff units. This result does not say the setup will win one trade in three. It says that, under those simplified payoff assumptions, a long-run win rate above 33.3% would be required for positive expectancy before costs.
04Cost-adjusted worked model#
Now assume an invented cost model in which total spread, fees and slippage equal 0.1R per completed trade. That number is not a live cost estimate.
Under this model:
- a gross 2R winner becomes 1.9R net;
- a gross 1R loser becomes 1.1R net.
The cost-adjusted break-even win rate is:
The cost-adjusted winner and loser sum to 3.0R.
1.1 ÷ (1.9 + 1.1) = 36.7%
Small costs matter most when stops and targets are tight. Use actual venue fees and a defensible slippage assumption when evaluating a real method.
05Expectancy connects payoff and win rate#
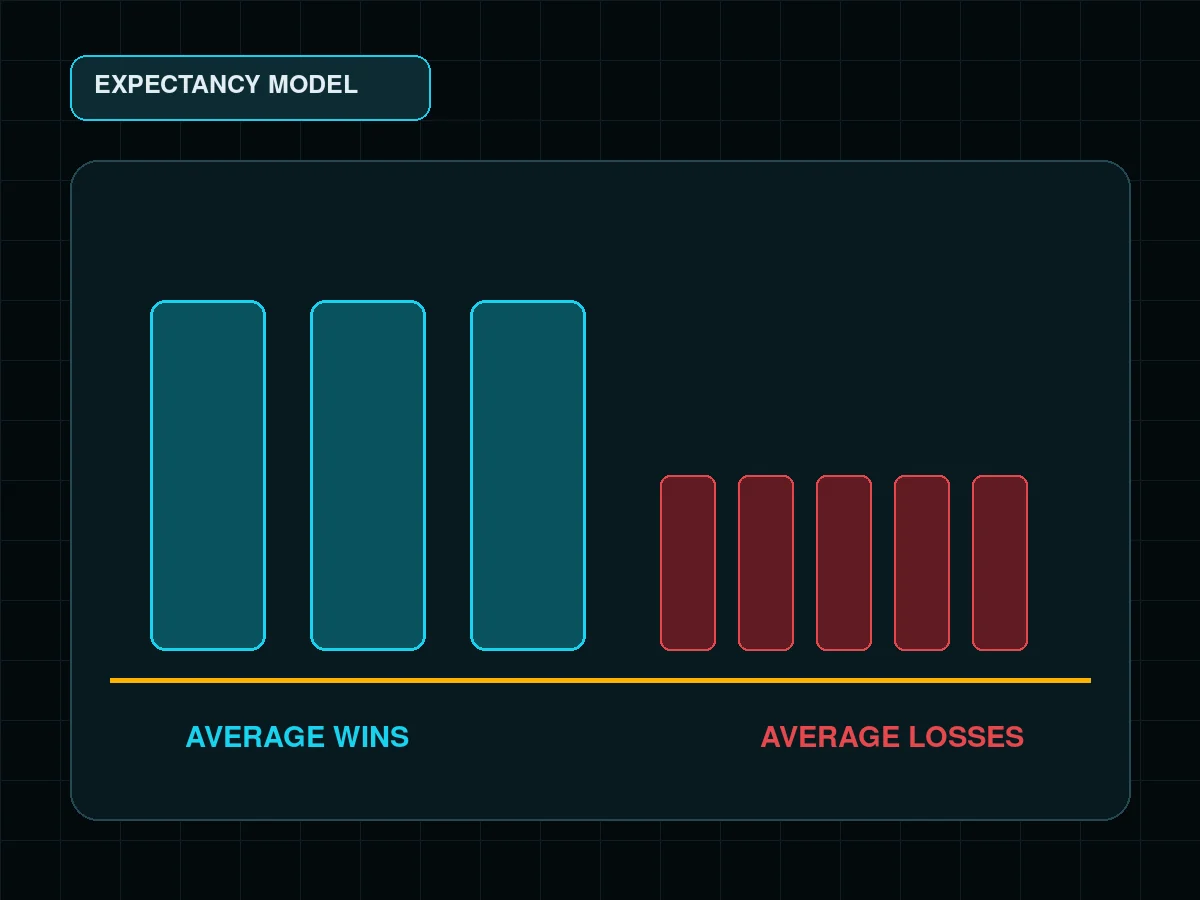
Expectancy expresses the average modeled result per trade:
expectancy = (win rate × average win) − (loss rate × average loss)
Assume an invented expectancy model with a cost-adjusted 1.9R winner and 1.1R loser, evaluated once at a 40% win rate (0.40 wins and 0.60 losses per trade) and once at a 30% win rate (0.30 wins and 0.70 losses per trade):
- at a modeled 40% win rate, the positive contribution is 0.76R and the negative contribution is 0.66R, leaving +0.10R;
- at a modeled 30% win rate, the positive contribution is 0.57R and the negative contribution is 0.77R, leaving -0.20R.
These are arithmetic scenarios, not backtest results. A real win-rate estimate needs a defined setup, raw trade records, consistent cost treatment and out-of-sample checking.
06Losing sequences and compounding#
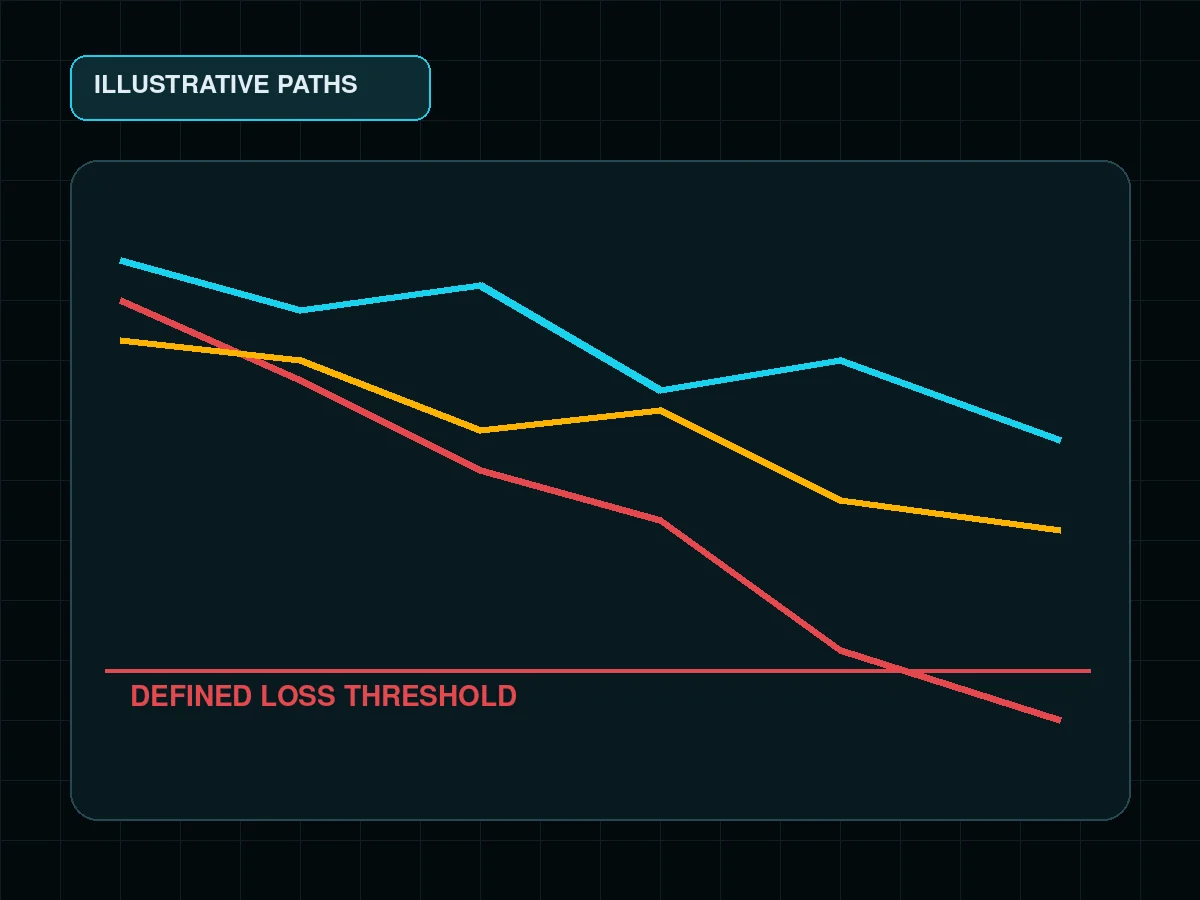
Even a positive-expectancy method can lose repeatedly. This article does not claim a probability for a particular streak because that would require a justified win-rate model and assumptions about whether trades are independent.
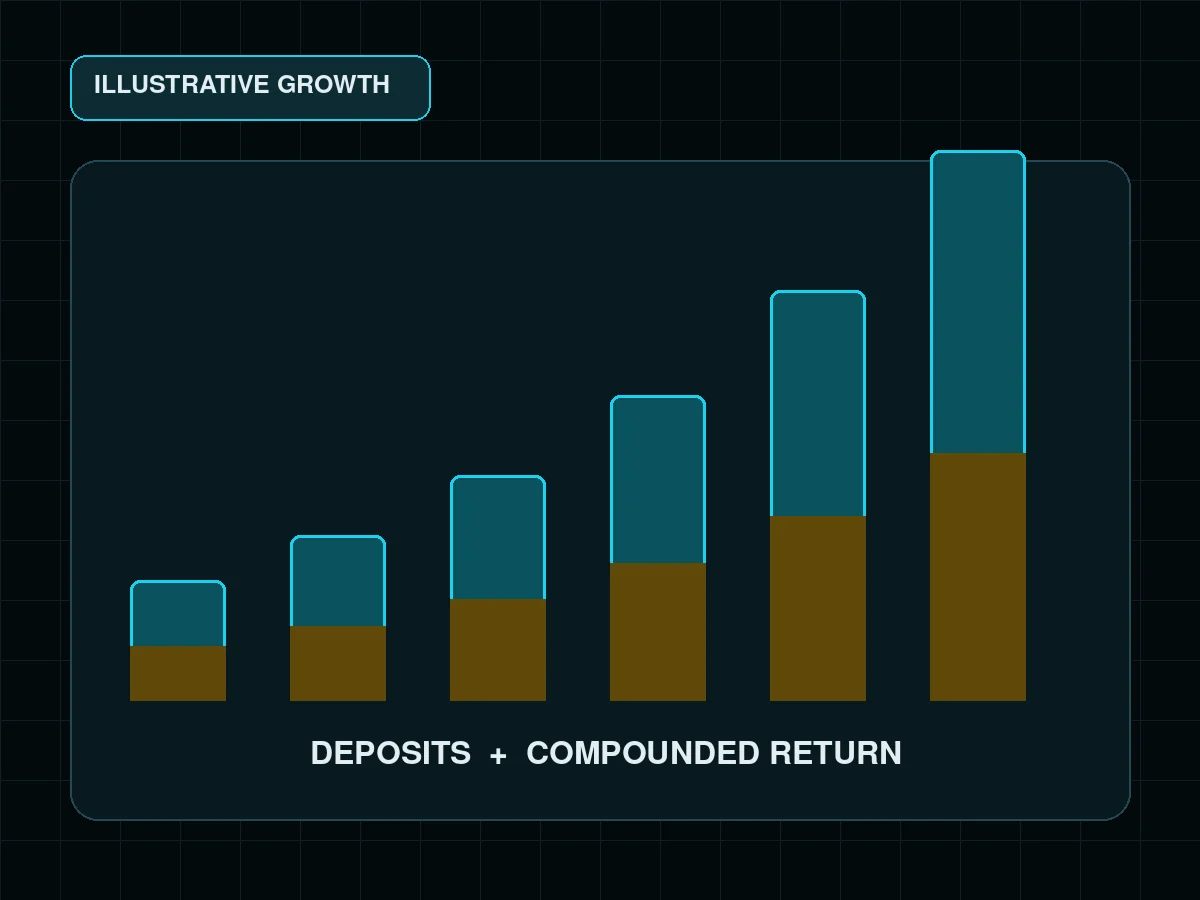
Assume an invented compounding model in which each loss reduces the current account by 1% and the sequence contains 10 consecutive modeled losses. The remaining fraction is:
0.99^10 = 0.9044
That is a modeled drawdown of 9.56%, before costs beyond the chosen 1% loss. It describes compounding, not the likelihood of the sequence.
07Execution can change the realized ratio#
Investor.gov explains that a stop order becomes a market order when triggered and that its execution price can differ from the stop price. A gap or thin order book can turn a planned 1R loss into more than 1R. A limit target may also remain unfilled.
Record realized entry, exit, fees and slippage. Comparing planned and realized R reveals whether the paper ratio survives execution.
08Practical checklist#
- Define entry, stop and target before calculating the ratio.
- Express outcomes in the same unit, preferably R.
- Include spread, fees, funding and modeled slippage.
- Do not infer win probability from the ratio.
- Measure realized rather than advertised payoffs.
- Recalculate after partial exits or stop changes.
09Sources#
Educational material, not investment advice. Worked values are transparent model assumptions, not market observations or performance claims.
FAQ#
How do you calculate the risk reward ratio?
What win rate breaks even at 1:2?
Is a higher ratio always better?
Can realized risk differ from the plan?

DoberInvest on Telegram
Questions about this guide?Ask in the English channel. That is also where we post charts, the levels we watch and what would change our mind. A system, not signals, and no profit promises.
This guide explains how the mechanics work; what you do with them is your own decision. Trading can lose you money, and leverage makes losses bigger and faster. 18+

Founder of DoberInvest, in the market since 2018. Teaches a system, not signals.