In this guide 6
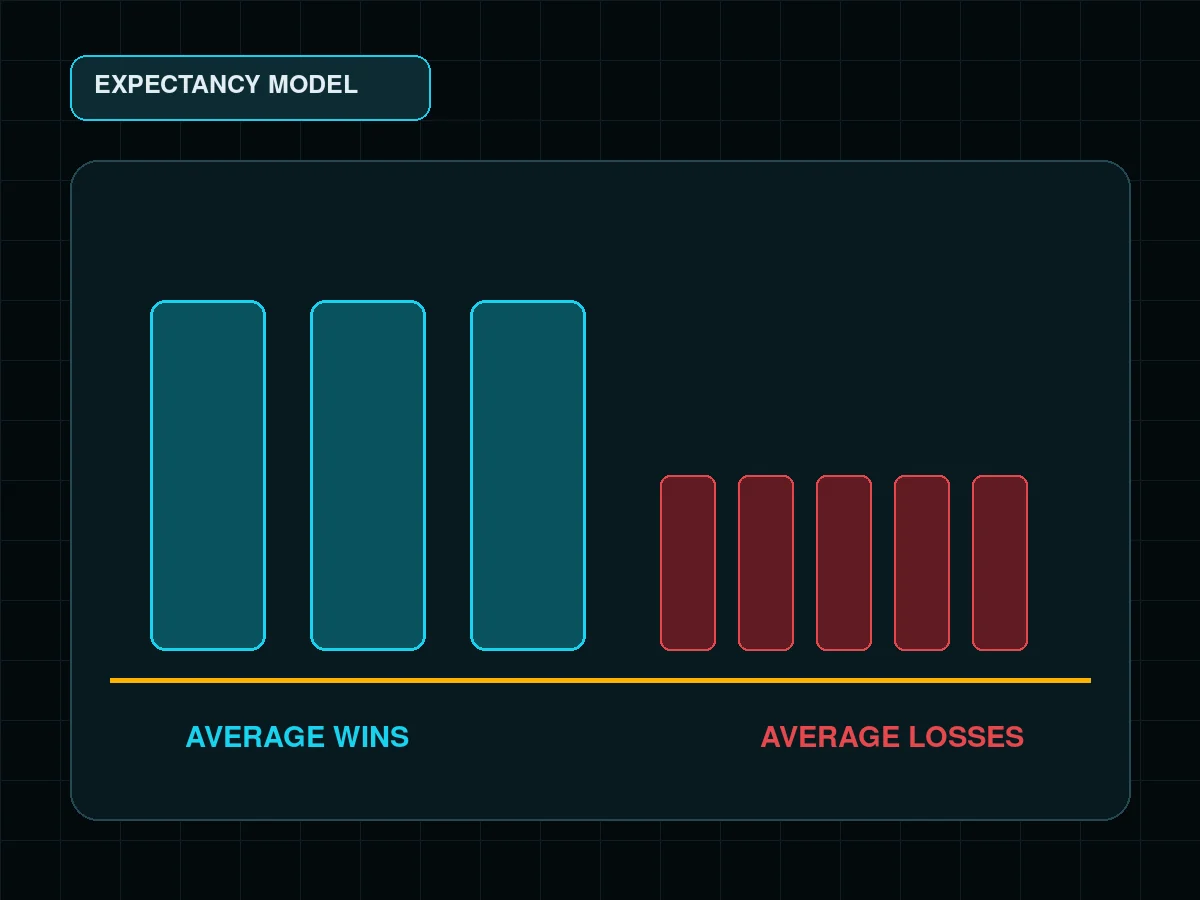
Break-even win rate is the share of trades that must win for average gains to offset average losses. It depends on what the average winner and average loser actually are, after trading costs.
Break-even win rate = Average loss / (Average win + Average loss)
Use positive magnitudes in the formula. In an illustrative case where winners average $200 and losers average $100, break-even is $100 divided by $300, or 33.3% before costs.
01Reward-to-risk table#
Illustrative reward-to-risk model: assume every loss is 1R and compare invented average wins of 0.5R, 1R, 1.5R, 2R and 3R.
| Average win | Average loss | Payoff sum | Break-even win rate |
|---|---|---|---|
| 0.5R | 1R | 1.5R | 66.7% |
| 1R | 1R | 2R | 50.0% |
| 1.5R | 1R | 2.5R | 40.0% |
| 2R | 1R | 3R | 33.3% |
| 3R | 1R | 4R | 25.0% |
This table is arithmetic, not evidence that a target will be reached. Wider targets are normally hit less often. Entries and exits determine whether the observed win rate clears the required rate.
02Add fees and slippage#
Illustrative cost model: assume a planned 1:2 setup on a $10,000 position. The stop is 1% or 0.01, so the gross loss is $100. The target is 2% or 0.02, so the gross win is $200.
In the same illustrative model, assume total entry and exit costs of 0.12% or a 0.0012 fraction of position, equal to $12 per completed trade. The net winner is $188, the net loser is $112, and their payoff sum is $300.
Break-even = 112 / (188 + 112) = 37.3%
Costs moved the required rate from 33.3% to 37.3%. In this illustrative model, a 35% win rate clears the gross threshold but remains below the after-cost threshold.
For a limit order, do not assume maker fees unless the fill report confirms the order rested and received maker treatment. An immediately marketable limit can be a taker order. Slippage should come from actual fills, not a fixed guess hidden in the result.
03Use realized averages, not planned targets#
Illustrative journal model: assume a sample contains 100 trades:
- 42 winners with average net gain of $160;
- 58 losers with average net loss of $105.
Total winning dollars are $6,720. Total losing dollars are $6,090. Net result is $630 before any costs omitted from the journal.
The break-even rate from those realized averages is:
105 / (160 + 105) = 105 / 265 = 39.6%
The observed 42% win rate is above 39.6%, which matches the positive result. The edge per trade is small: $630 divided by 100, or $6.30. A modest increase in slippage could erase it.
04Partial exits change the average win#
Illustrative partial-exit model: assume half closes at 1R and half at 2R. Adding the two weighted pieces, 0.5R and 1R, produces a 1.5R gross winner when both parts fill. Moving the stop to entry on the second half creates other outcomes. Calculate each trade from cash profit or loss, then express it in R if needed.
The same applies to missed stops, gaps and discretionary exits. The planned chart ratio is useful before entry. The realized average belongs in performance analysis.
05Confidence needs a sample#
A short run can produce a striking win rate by chance. A larger sample does not make the future certain, but it reduces how much one trade changes the estimate. Separate strategies, markets and timeframes if their payoff shapes differ.
Record:
- entry and exit timestamps;
- gross result;
- all fees and funding;
- slippage against the decision price;
- planned R and realized R;
- rule violations.
Then calculate the break-even rate for the actual sample. Compare it with the observed rate and with the average result per trade. None of the three should be used alone.
The formula answers one narrow question: how often must this payoff distribution win? It does not prove that future trades will keep the same distribution. Use the risk-reward ratio page for the planned payoff, include the execution loss described in the slippage guide, check the maker-versus-taker fee guide before setting the cost input, then keep realized results in a trading journal. This page is specifically about the win-rate threshold after costs.
Run the calculation again after a material change in market, timeframe, execution method or position management. Combining unlike trades can produce one neat percentage that describes none of the underlying processes well.
Source basis checked November 5, 2026: the formula and examples are independently reproducible arithmetic; execution-cost treatment follows Coinbase Advanced fee definitions and Coinbase order management.
FAQ#
What is the break-even win rate formula?
Why do fees raise the required win rate?
Should I use planned or realized wins and losses?

DoberInvest on Telegram
Questions about this guide?Ask in the English channel. That is also where we post charts, the levels we watch and what would change our mind. A system, not signals, and no profit promises.
This guide explains how the mechanics work; what you do with them is your own decision. Trading can lose you money, and leverage makes losses bigger and faster. 18+

AI-assisted editorial draft prepared and fact-checked against the cited sources; published by the DoberInvest editorial team, not as Konstantin Shulga's personal experience.