In this guide 7
Dollar-cost averaging means investing the same cash amount at regular intervals. Investor.gov defines it as equal portions invested on a schedule regardless of market moves. The arithmetic is simple: divide each contribution by that period's purchase price, add the units, then divide total cash by total units.
It does not ensure a profit or a better result than investing immediately. Its practical benefit is procedural: the schedule removes the need to choose one perfect entry date. The cost is that some cash waits outside the market.
01The calculation#
For each purchase:
Units bought = Contribution / Purchase price
Average cost = Total contributions / Total units
Current value = Total units x Current price
Return = Current value - Total contributions
Use actual fill prices and include trading fees. A displayed chart price is not necessarily the price at which the order filled; the separate slippage guide explains how execution can move away from the decision price.
02Six-month worked example#
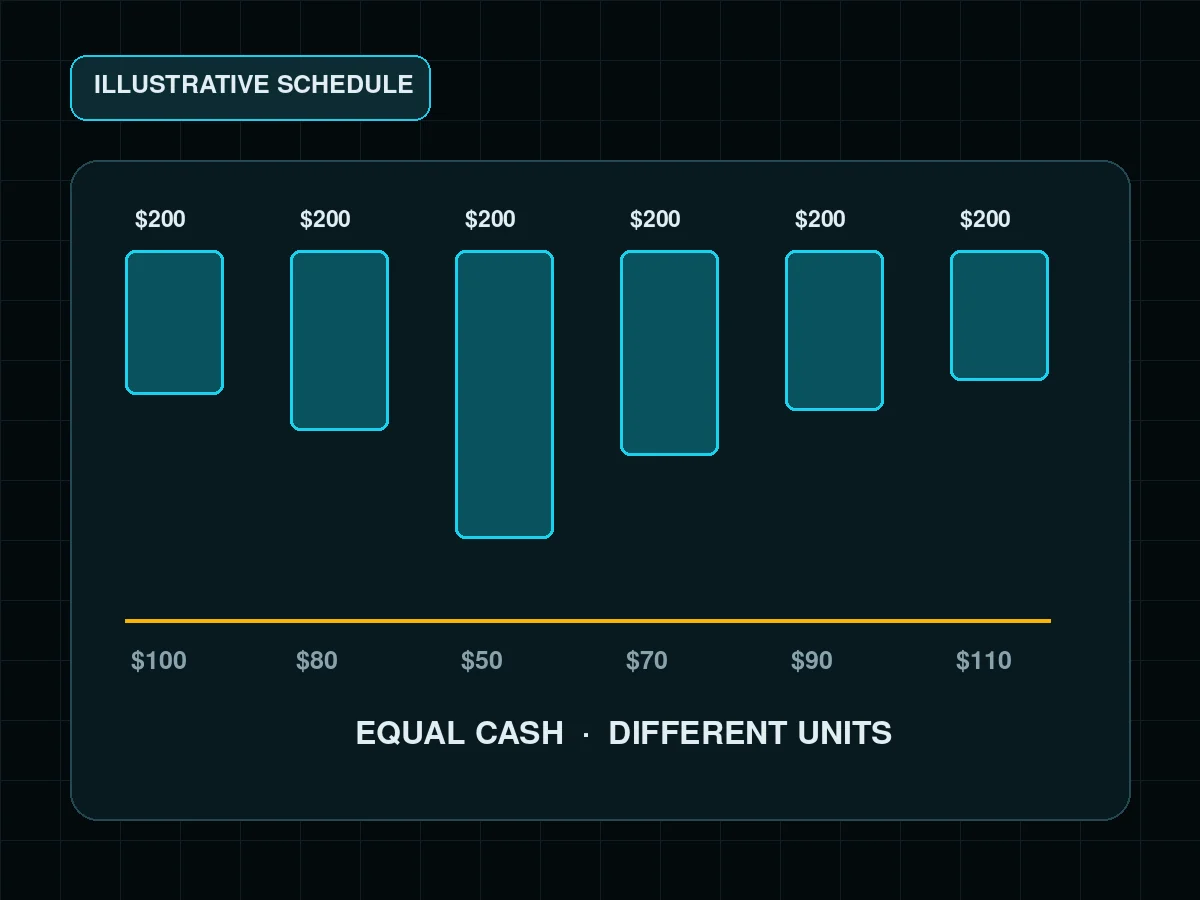
Assume an illustrative fund with no trading fee and 6 contributions of $200, one at the start of each month. The invented prices are $100, $80, $50, $70, $90 and $110.
| Month | Price | Cash | Units bought |
|---|---|---|---|
| 1 | $100 | $200 | 2.000000 |
| 2 | $80 | $200 | 2.500000 |
| 3 | $50 | $200 | 4.000000 |
| 4 | $70 | $200 | 2.857143 |
| 5 | $90 | $200 | 2.222222 |
| 6 | $110 | $200 | 1.818182 |
Total cash is $1,200. Total units are 15.3975. The average cost is $1,200 divided by 15.3975, or about $77.93 per unit. At a current price of $110, the position is worth about $1,693.73, an unrealized gain of $493.73.
The arithmetic sum of the six invented prices is $500, so their simple average is $83.33. That is not the investor's average cost. More units were bought in the cheaper months. Always calculate from cash divided by units.
03Compare with a lump sum without cheating#
A fair comparison needs the same starting cash and the same dates. If all $1,200 was available at month one, a lump sum at $100 buys 12 units and is worth $1,320 at the final $110 price. In this invented falling-then-rising path, the schedule did better because much of the money bought after the decline.
Change the path and the answer changes. If price rises from $50 to $110 without a large decline, the lump sum gets more time invested at the lower starting price. This is why one selected chart cannot prove that either method always wins.
If the money only becomes available $200 at a time from income, there is no honest lump-sum alternative at month one. The useful comparison is then regular investing versus leaving each contribution in cash.
04Add fees and spreads#
Illustrative fixed-fee model: assume each purchase has a $2 commission, each contribution is $200, there are 6 purchases, and the comparison order is $2,000. Only $198 of each $200 contribution buys units. Total fixed fees are $12. The $2 charge is 1% of $200 but 0.1% of $2,000. The maker-versus-taker fee guide shows why an order's type does not by itself determine the cheaper fee.
Illustrative percentage-fee model: assume a 0.2% fee, equal to a 0.002 fraction. Subtracting that fraction from a 1.000 gross factor gives a 0.998 net factor. Multiply each contribution by the factor before dividing by price. Also record the spread between bid and ask. A market order may fill at several prices when liquidity is thin.
05A spreadsheet layout#
Create columns for date, contribution, fill price, fee and units. In each row:
Net cash = Contribution - Fee
Units = Net cash / Fill price
At the bottom, sum contributions and units. Divide total contributions, including fees, by total units. Keeping fees inside the numerator shows the true break-even price.
06When a schedule is useful#
- Income arrives regularly and the investor wants a repeatable rule.
- The timing decision causes repeated delay or emotional changes.
- The asset fits a long-term plan and the investor can tolerate drawdowns.
- Fees are small relative to each contribution.
It is a poor substitute for research. Regularly buying a concentrated, unsuitable or failing asset only repeats the same risk. The schedule should sit inside an allocation plan, with an emergency reserve outside the market.
The next useful step is to write the amount, frequency, eligible assets and conditions that would pause the plan. Then calculate units from actual statements rather than judging the method from the account balance alone. Compare the saving path with the site's risk-per-trade guide only when the task is active trading risk; the two calculations answer different questions.
Primary source checked November 5, 2026: Investor.gov definition of dollar-cost averaging.
FAQ#
How do I calculate my DCA average price?
Does dollar-cost averaging always beat a lump sum?
Should fees be included in a DCA calculator?

DoberInvest on Telegram
Questions about this guide?Ask in the English channel. That is also where we post charts, the levels we watch and what would change our mind. A system, not signals, and no profit promises.
This guide explains how the mechanics work; what you do with them is your own decision. Trading can lose you money, and leverage makes losses bigger and faster. 18+

AI-assisted editorial draft prepared and fact-checked against the cited sources; published by the DoberInvest editorial team, not as Konstantin Shulga's personal experience.