In this guide 7
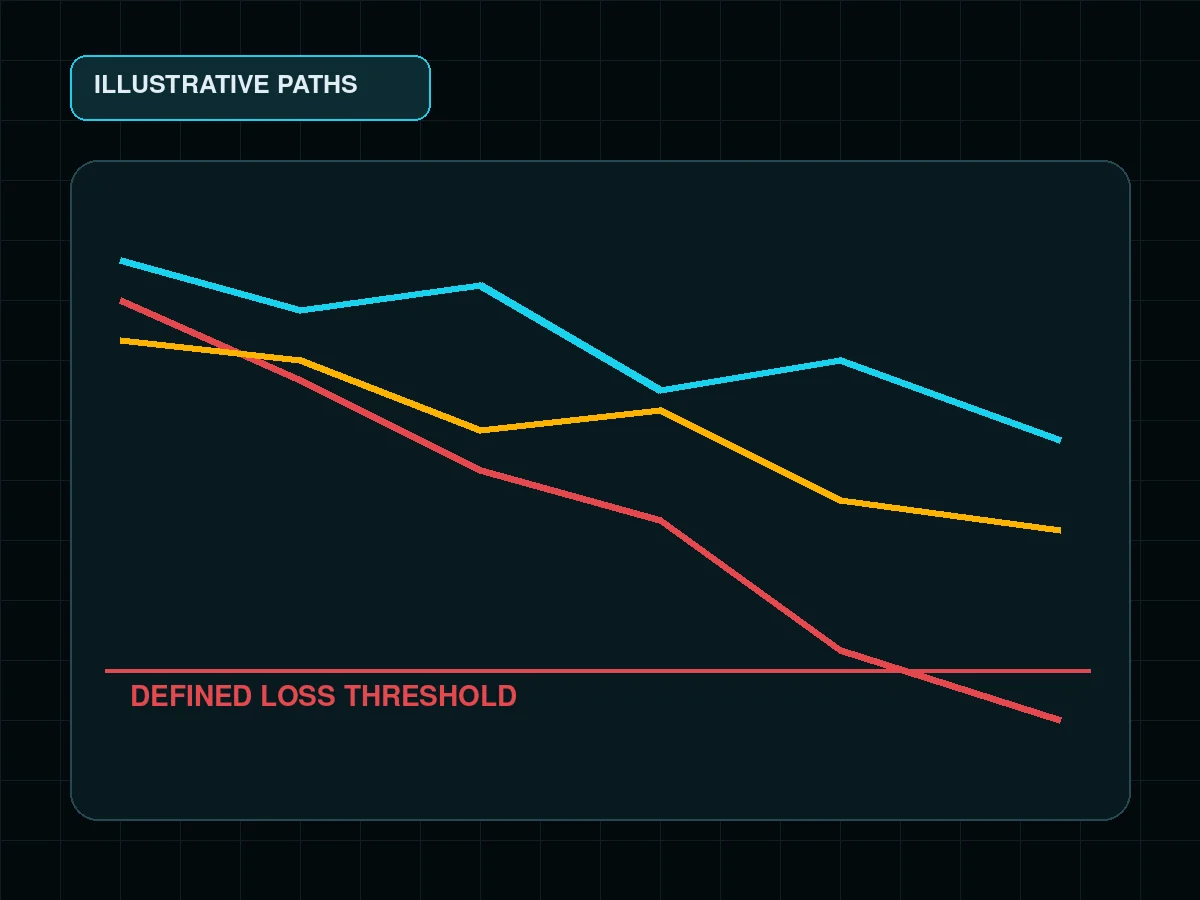
Risk of ruin is the probability that a trading process reaches a chosen loss threshold before it recovers or reaches a goal. An illustrative policy threshold might be a 50% drawdown; another process may stop earlier. Calculators disagree because they use different definitions and assumptions.
Start with a simpler question you can reproduce exactly: what does a losing streak do when risk is a fixed percentage of current equity?
01Drawdown after consecutive losses#
Equity after n losses = Starting equity x (1 - risk per trade)^n
Drawdown = 1 - (1 - risk per trade)^n
Illustrative streak model: assume starting equity is a 1.00 fraction, then apply 10 consecutive full-risk losses and compare risk inputs of 0.5%, 1%, 2% and 5% of current equity, represented by equity multipliers of 0.995, 0.99, 0.98 and 0.95.
| Risk per trade | Equity multiplier | Equity fraction | Equity left | Drawdown |
|---|---|---|---|---|
| 0.5% | 0.995 | 0.9511 | 95.11% | 4.89% |
| 1% | 0.99 | 0.9044 | 90.44% | 9.56% |
| 2% | 0.98 | 0.8171 | 81.71% | 18.29% |
| 5% | 0.95 | 0.5987 | 59.87% | 40.13% |
The losses compound on a shrinking balance. In this illustrative streak model, 10 losses at 5% leave 59.87% of starting equity and a 40.13% drawdown. Recovering 40.13 points from a 59.87 base requires a gain of about 67.03%.
02Define ruin before calculating it#
An account does not need to reach zero to become unusable. In the illustrative 50% policy-threshold model, a 0.50 remaining fraction needs a 1.00 gain fraction to restore the starting balance. In plain terms, the remaining half must double. A margin call, minimum order size or personal stop rule may end the process earlier.
Write the threshold explicitly:
- hard ruin: account equity reaches a near-zero floor;
- operational ruin: equity cannot support the strategy's minimum size;
- policy ruin: drawdown reaches the trader's mandatory stop level;
- emotional ruin: losses cause the trader to abandon or change rules.
Only the first three can be represented cleanly in a calculator. The fourth still matters in choosing risk.
03A simple fixed-bet model#
One common textbook model assumes every trade wins or loses one equal unit, trades are independent, and the probability of a win never changes. If win probability is p, loss probability is q, and the bankroll contains N equal loss units, a simplified probability of eventually losing all units when p is greater than q is approximately:
Risk of ruin = (q / p)^N
Assume a 55% win probability, 45% loss probability and a bankroll of 20 equal loss units. In this illustrative fixed-bet model, q divided by p is about 0.8182. The model gives:
(0.45 / 0.55)^20 = about 1.8%
In the same illustrative fixed-bet model, 10 loss units produce about 13.4%. More loss units between current equity and the ruin threshold reduce the modelled probability.
This is an illustration of the formula, not a forecast. Real trading violates its assumptions: wins and losses differ in size, trades cluster, costs vary, and the measured win rate is uncertain.
04Why expectancy alone is insufficient#
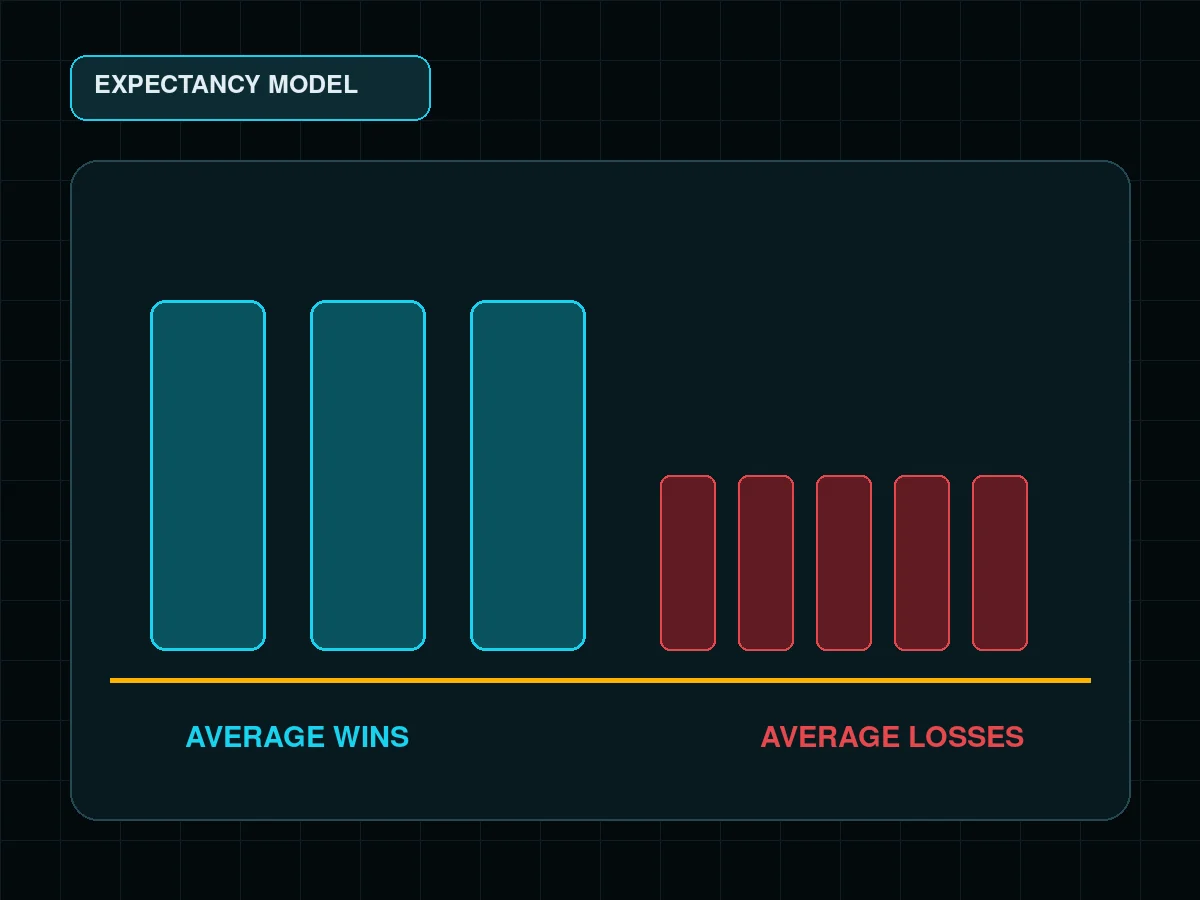
A process can have positive average expectancy and still suffer a damaging path. Illustrative expectancy model: assume wins average 1.2R, losses 1R and the win rate is 50%. The weighted win is 0.60R and the weighted loss is 0.50R:
Expectancy = 0.50 x 1.2R - 0.50 x 1R = 0.10R
Positive expectancy does not prevent ten losses in a row. Increasing risk per trade magnifies both growth and drawdown, while the estimated edge may be noise.
05A practical stress test#
- Use net results after fees and slippage.
- Define the drawdown where trading must stop.
- Simulate or enumerate losing streaks longer than the historical maximum.
- Reduce average wins and win rate in separate scenarios.
- Increase costs and gap losses.
- Include correlated positions as one combined risk event.
- Recalculate when size, market or rules change.
If the plan fails after an ordinary streak, lower risk rather than relying on the historical average to return on schedule.
06Model limits to state beside the result#
- Historical trades are not independent samples from a permanent distribution.
- A small sample makes win rate and payoff estimates unstable.
- Stop orders can fill beyond their trigger price.
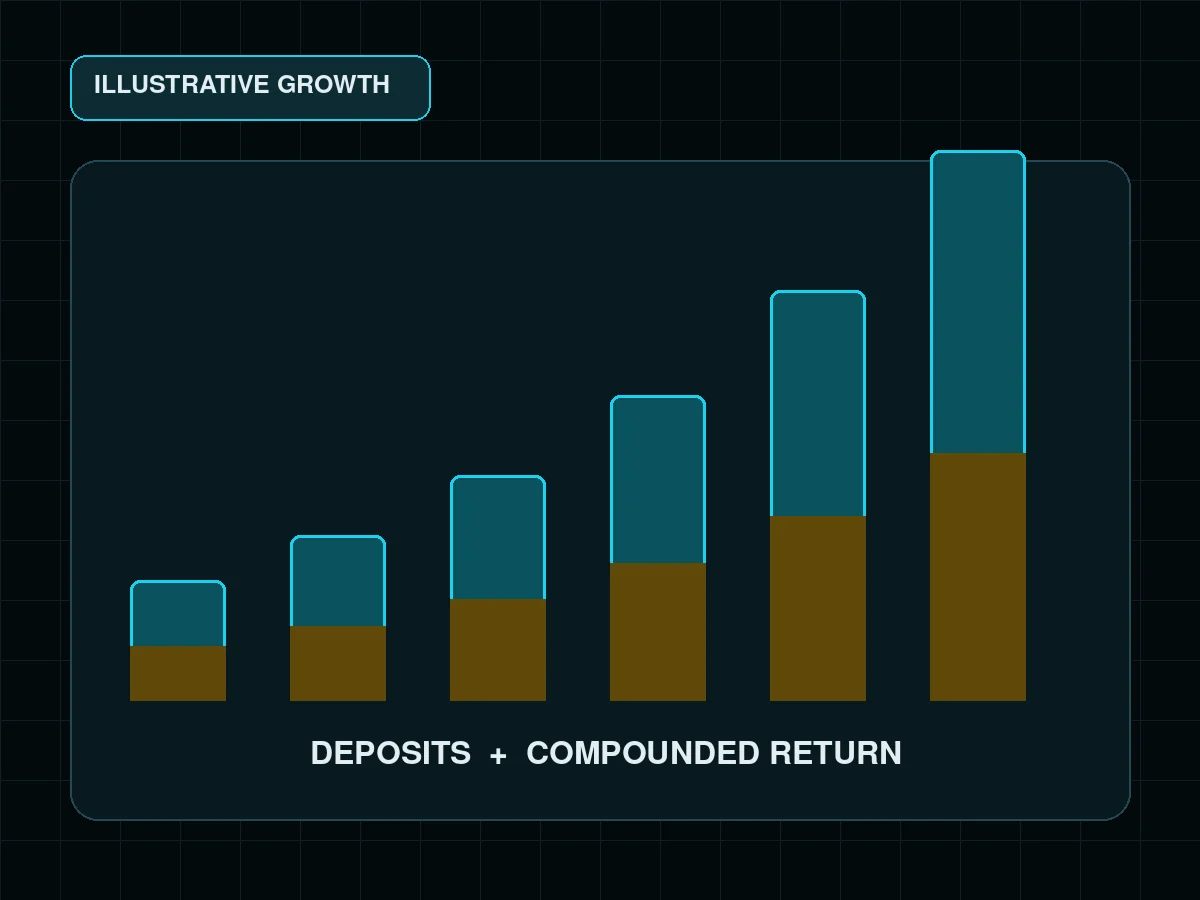
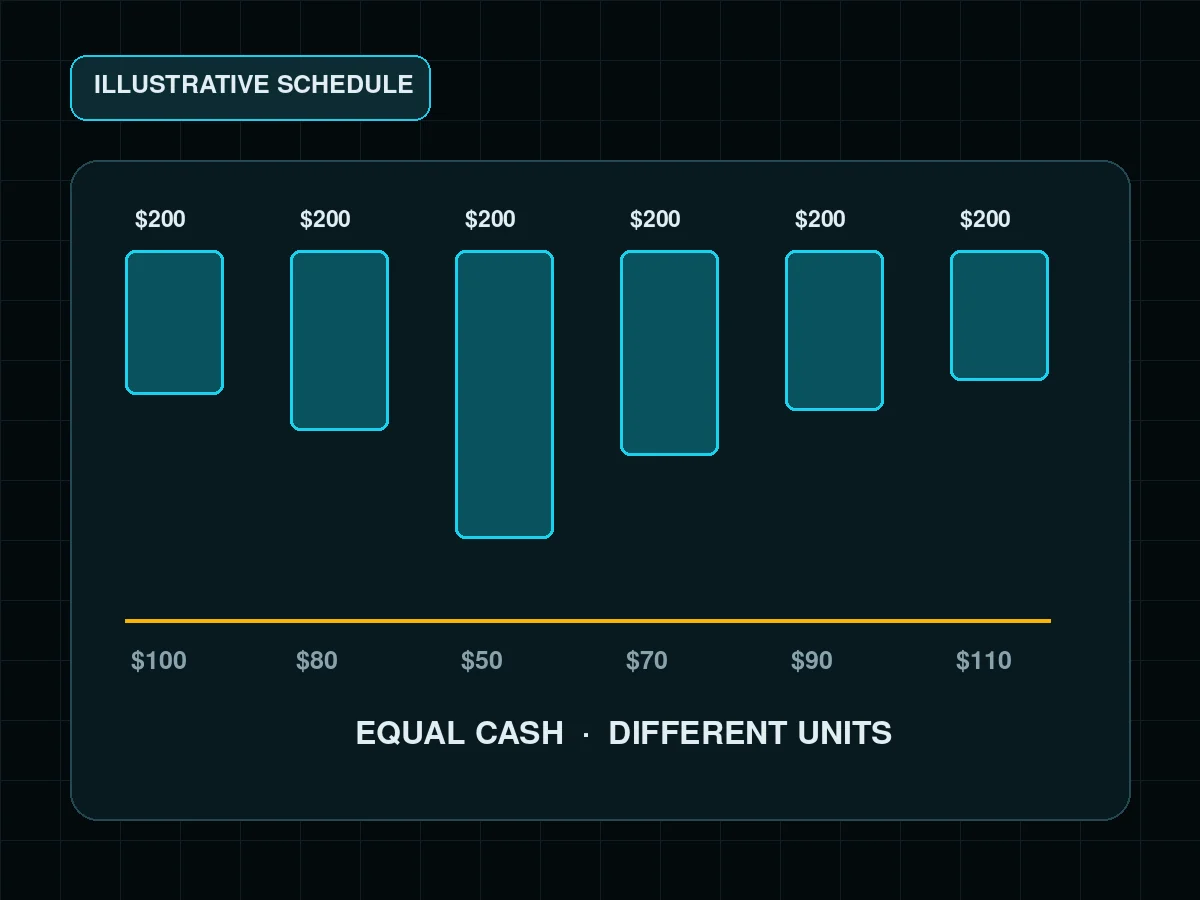
- Percentage sizing changes the cash amount after every result.
- Multiple positions can lose together.
- Strategy changes invalidate the old sample.
A useful calculator shows these inputs and limitations. A single percentage without them creates false precision.
The next step is to calculate several losing-streak lengths at the intended risk size, including a path longer than the historical maximum. If those paths are unacceptable, the risk setting is already too high before a more complex ruin model is needed. Check where the trade thesis actually fails with the stop-loss placement guide and include the execution gap described in the slippage guide. The risk-per-trade guide explains the drawdown asymmetry behind the sizing rule, and a trading journal provides the realized sample needed to update the assumptions.
Recalculate after changing the strategy or sizing rule. A percentage copied from an old sample is not a durable property of the account, and correlated positions can turn several nominal trades into one shared loss event.
Source basis checked November 5, 2026: all numerical examples are independently reproducible arithmetic; general margin-loss risk is consistent with FINRA's investor guide to frequent trading.
FAQ#
What does ruin mean in a trading calculator?
Why do risk-of-ruin calculators disagree?
Is the fixed-bet formula a forecast?

DoberInvest on Telegram
Questions about this guide?Ask in the English channel. That is also where we post charts, the levels we watch and what would change our mind. A system, not signals, and no profit promises.
This guide explains how the mechanics work; what you do with them is your own decision. Trading can lose you money, and leverage makes losses bigger and faster. 18+

AI-assisted editorial draft prepared and fact-checked against the cited sources; published by the DoberInvest editorial team, not as Konstantin Shulga's personal experience.