
In this guide 6
A trading journal is a record of every trade: what you traded, where the entry, stop and target were, why you entered, how you felt, and the result in R, units of the risk you took. Memory keeps the wins and edits out the mistakes. After 30 to 50 trades a journal shows your real win rate, your expectancy, and which setups and emotions cost you money. It only works if you review it, not just fill it in.
01Why bother#
A journal is not an archive kept for the sake of it. It is a mirror. It shows not what you think you do in the market, but what you actually do.
Without one, you step on the same rake again and again, because you cannot see it. With one, the rake becomes a row in a table. The most common discovery when people start: most of the losses come from a small group of trades taken without a plan, on emotion.
02What to record#
Record the process, not just the outcome. The outcome lies; the process does not.
| Field | Example |
|---|---|
| Asset and side | BTC, long |
| Entry, stop, target | 100, 98, 104 |
| Setup, one honest phrase | Bounce at support plus a reversal candle |
| Emotion at entry | Calm / fear of missing out / revenge |
| Result in R | +2R, −1R, +0.5R |
Three numbers, entry, stop and target, are the minimum. Without them there was no trade, only a click. The emotion column looks soft, and it is where half of the answers hide.
03Why measure in R#
R is the amount you risked: the distance from entry to stop multiplied by position size. A full stop-out is −1R; a trade that made twice its risk is +2R.
Measuring in R instead of dollars puts every trade on the same scale, whatever the account size or the asset, and it makes the next number possible.
04What the numbers will show you#
Win rate is how often you are right. Surprise: it is not the main number.
Expectancy is what you make per trade on average, in R:
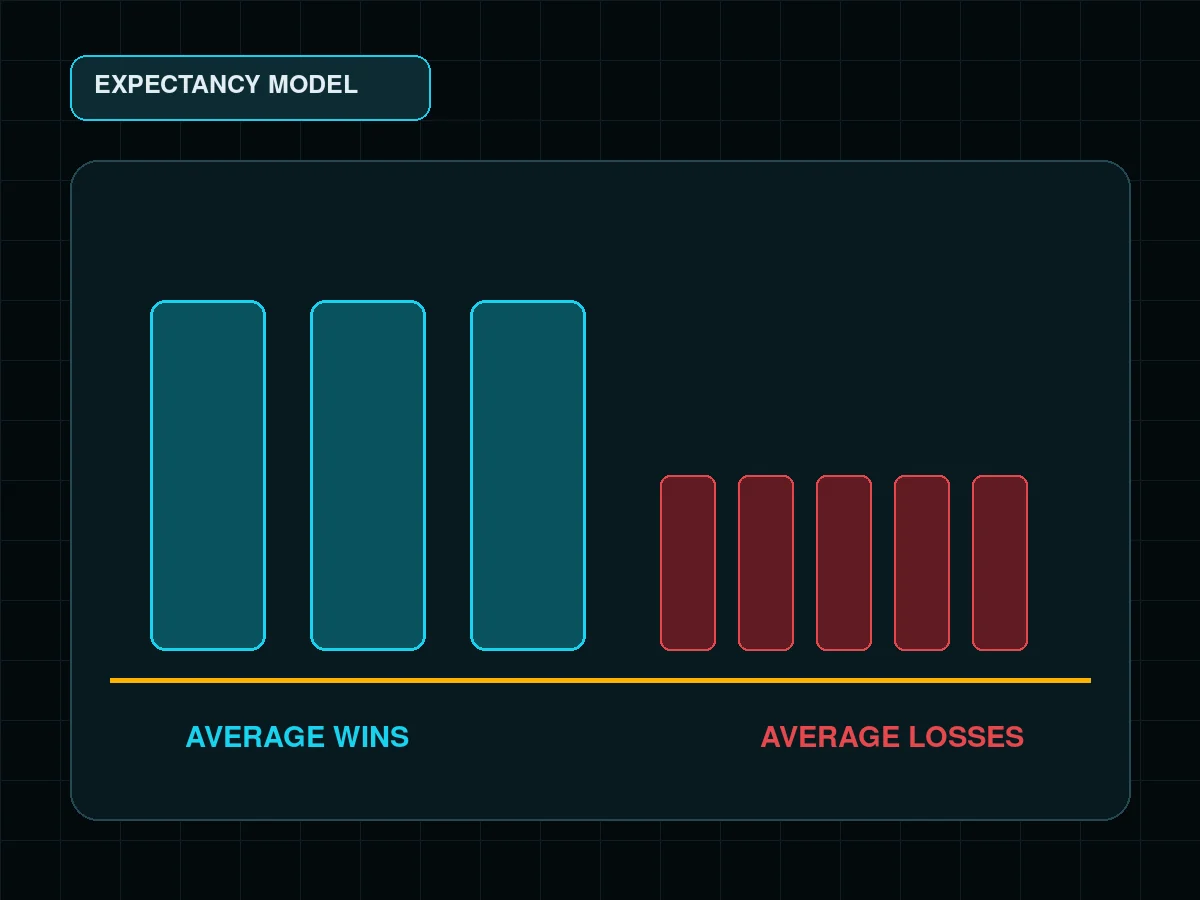
Expectancy = win rate × average win − loss rate × average loss
With a 40% win rate, an average win of 2R and an average loss of 1R: 0.4 × 2 − 0.6 × 1 = +0.2R per trade. You are wrong more often than right and still ahead.
The break-even win rate depends on the reward-to-risk ratio:
| Average win vs loss | Win rate needed to break even |
|---|---|
| 1 : 1 | 50% |
| 2 : 1 | 33.3% |
| 3 : 1 | 25% |
Where you lose is the most valuable output: which setup or which emotion consistently produces minus R. Remove it, and the equity curve straightens out.
05The loop that makes it work#
A journal works as a loop, not an archive:
- Record every trade, the same fields every time.
- Review weekly: win rate, average R, expectancy, and the worst setup or emotion.
- Change one behavior based on that review.
- Check next week whether the change helped.
Keeping a journal and never rereading it is useless. Rereading it and changing nothing is just as useless.
Boring? Yes. That is exactly why most traders never keep one, and why those who do get ahead. Do not take this on faith: check it on your own next 30 trades, sized by the rules in risk per trade.
FAQ#
What should I record in a trading journal?
What is R in trading?
Can I be profitable with a win rate below 50%?
How many trades before the journal tells me something?
How often should I review my journal?

DoberInvest on Telegram
Questions about this guide?Ask in the English channel. That is also where we post charts, the levels we watch and what would change our mind. A system, not signals, and no profit promises.
This guide explains how the mechanics work; what you do with them is your own decision. Trading can lose you money, and leverage makes losses bigger and faster. 18+

Founder of DoberInvest, in the market since 2018. Teaches a system, not signals.