In this guide 7
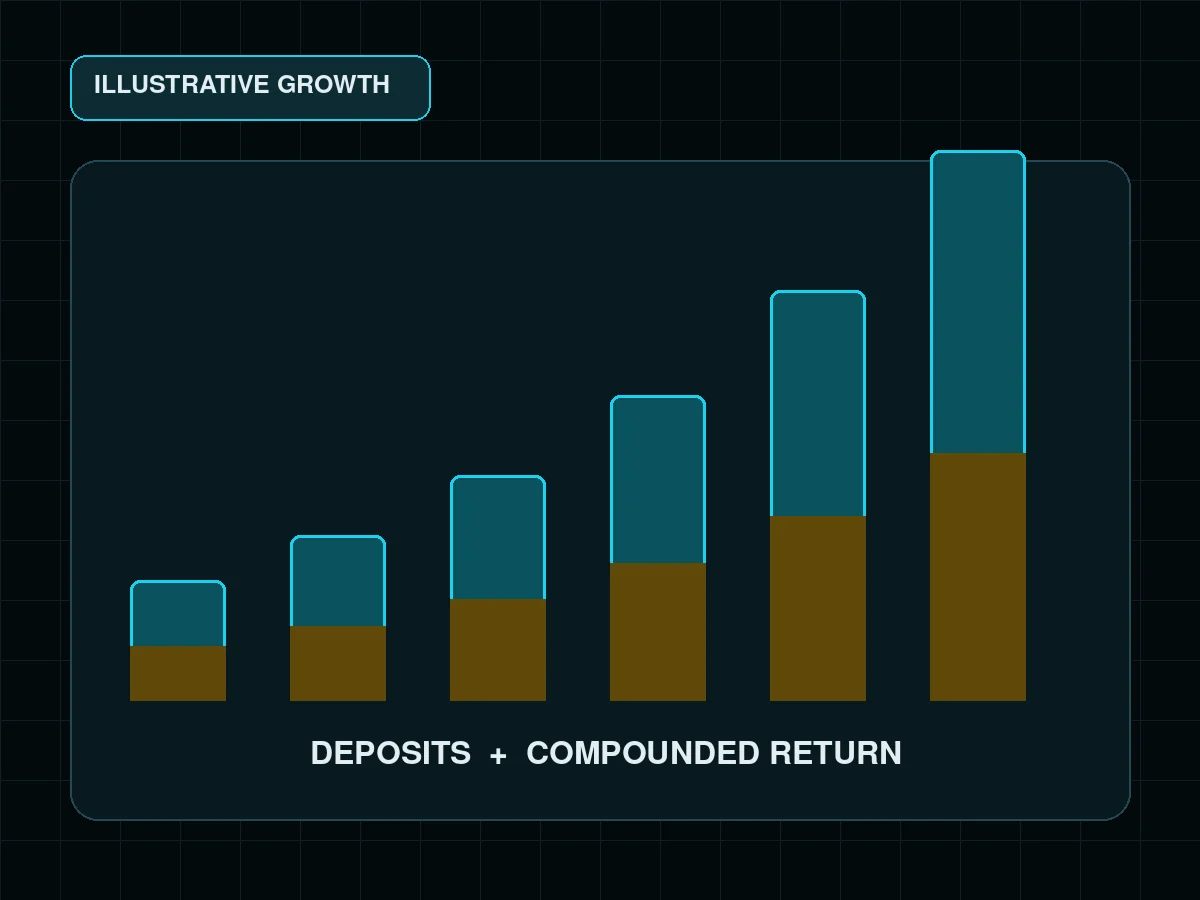
Compound interest means future returns are calculated on the original balance and on earlier returns that remain invested. A calculator is useful only when its assumptions are visible. The return is not a promise, tax and fees matter, and a smooth annual rate hides the path markets take.
01The formula for one deposit#
Future value = Principal x (1 + annual rate / compounds per year)^(years x compounds per year)
Illustrative model: assume a $100 balance and an invented 5% annual rate with annual compounding for 2 years. A 5% rate is a 0.05 fraction; a 1.00 base plus 0.05 gives a one-year multiplier of 1.05.
Year 1: $100 multiplied by 1.05 = $105
Year 2: $105 multiplied by 1.05 = $110.25
The balance gained $10.25 before tax, fees and inflation. The example is mathematics, not a forecast for any asset. A calculator may evaluate the exponent directly, but showing the two annual steps makes the compounding visible.
02Add monthly contributions#
Regular deposits form an annuity. If contributions arrive at the end of each month:
Value of deposits = Monthly deposit x [((1 + monthly rate)^months - 1) / monthly rate]
Calculate the starting balance and the contribution stream separately, then add them. Each deposit has a different time in the account, so multiplying the final monthly deposit by the full horizon would overstate the result.
Deposits made at the start of each month get one extra month of growth. Multiply the deposit result by one plus the monthly rate to model that timing. Do not mix start-of-month deposits in one calculator with end-of-month deposits in another and call the difference performance.
03Annual, monthly and daily compounding#
At the same nominal annual rate, more frequent compounding produces a higher effective rate because returns are added to the base sooner. A product's quoted annual percentage yield may already include compounding, while a nominal annual rate may not. Check the definition before entering it. Do not compare one calculator using a nominal rate with another using an effective yield and attribute the difference to investment performance.
04Inflation changes what the balance buys#
Nominal dollars are not purchasing power. One simple adjustment is:
Real value = Future nominal value / (1 + inflation rate)^years
Illustrative two-year inflation model: assume annual inflation of 2%, which gives an annual price-level multiplier of 1.02. Over two years, the multiplier is 1.02 multiplied by 1.02, or 1.0404. The $110.25 balance is therefore $110.25 divided by 1.0404, or about $105.97 in starting-year dollars. The account is larger, but part of the nominal growth only offsets higher prices.
This does not predict inflation. Use cautious, middle and adverse scenarios, and label every rate as an assumption.
05Fees compound too#
Illustrative fee model: assume a gross annual rate of 5% and a 1% annual charge applied as a simple planning deduction. The rough net planning rate is 4% before tax. This subtraction is only an approximation; actual products can deduct expenses continuously, from assets, or through separate billing.
For a precise model, apply fees according to how the product actually deducts them. Trading commissions reduce contributions; ongoing fund expenses reduce returns; advisory fees may be billed separately.
06Sensible calculator inputs#
- Use a range of returns, not one confident number.
- Separate contributions from investment growth.
- Match the compounding frequency to the quoted rate.
- Include fees, tax assumptions and inflation separately.
- Keep a zero-return scenario. It shows how much of the goal comes from saving rather than markets.
- Do not use a historical average as a certain annual result.
Investor.gov's calculator asks for an initial investment, monthly contribution, time, estimated rate, a variance range and compounding frequency. That structure is useful because it makes the major assumptions explicit.
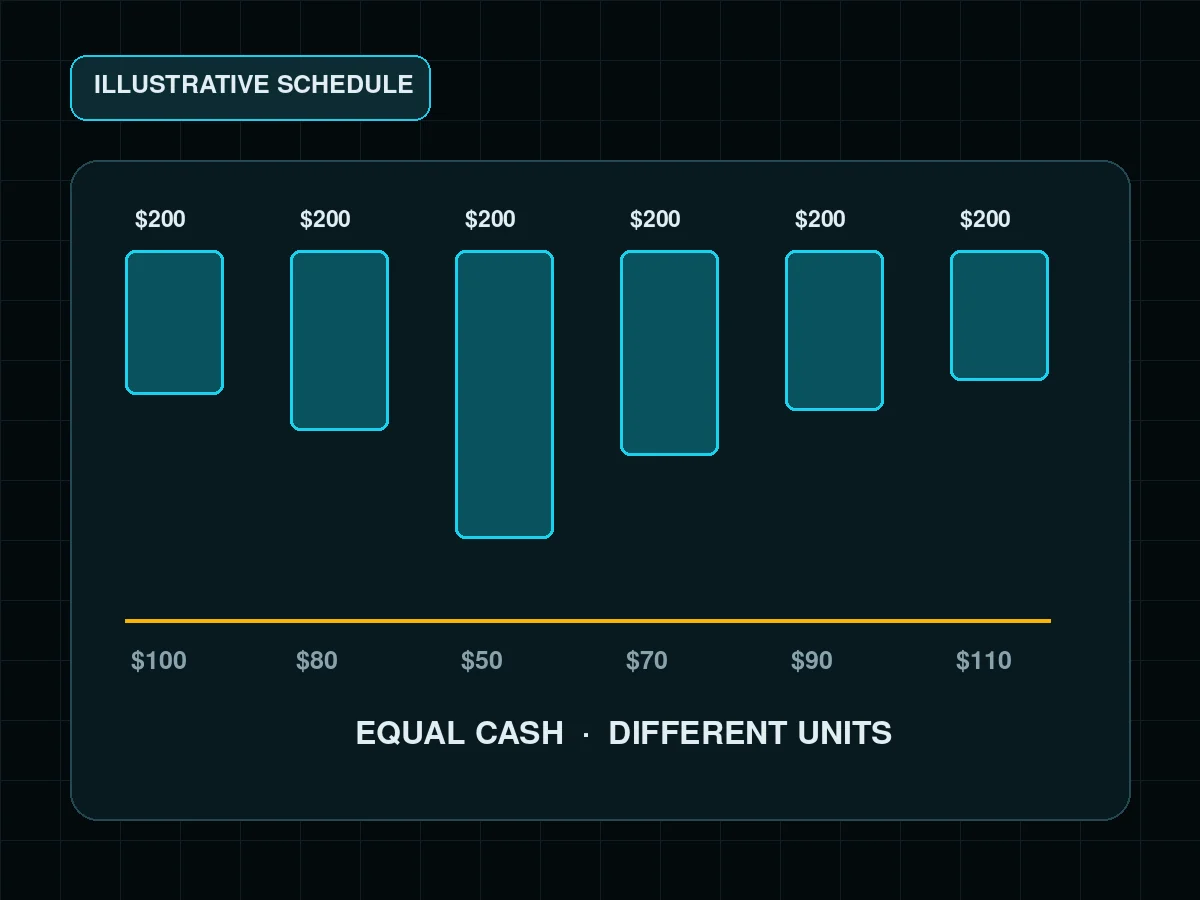
The next step is to save three scenarios: cautious, middle and optimistic. If the goal only works in the optimistic case, the plan needs a higher contribution, a longer horizon or a smaller target. A regular contribution schedule can also be checked with the separate dollar-cost averaging calculator, which focuses on units and fill prices rather than a smooth assumed return.
Keep assumptions and actual results in a trading journal so a projection is not confused with performance. For money assigned to active trades, start with the risk-per-trade guide instead of treating smooth compound growth as risk control. When the modeled asset is a token, the crypto market cap guide explains why price and market capitalization are not the same as cash invested or available liquidity.
Primary sources checked November 5, 2026: Investor.gov compound interest calculator and Investor.gov explanation of compound interest.
FAQ#
What is the compound interest formula?
How do monthly contributions change the result?
Why should a calculator include inflation and fees?

DoberInvest on Telegram
Questions about this guide?Ask in the English channel. That is also where we post charts, the levels we watch and what would change our mind. A system, not signals, and no profit promises.
This guide explains how the mechanics work; what you do with them is your own decision. Trading can lose you money, and leverage makes losses bigger and faster. 18+

AI-assisted editorial draft prepared and fact-checked against the cited sources; published by the DoberInvest editorial team, not as Konstantin Shulga's personal experience.