
In this guide 6
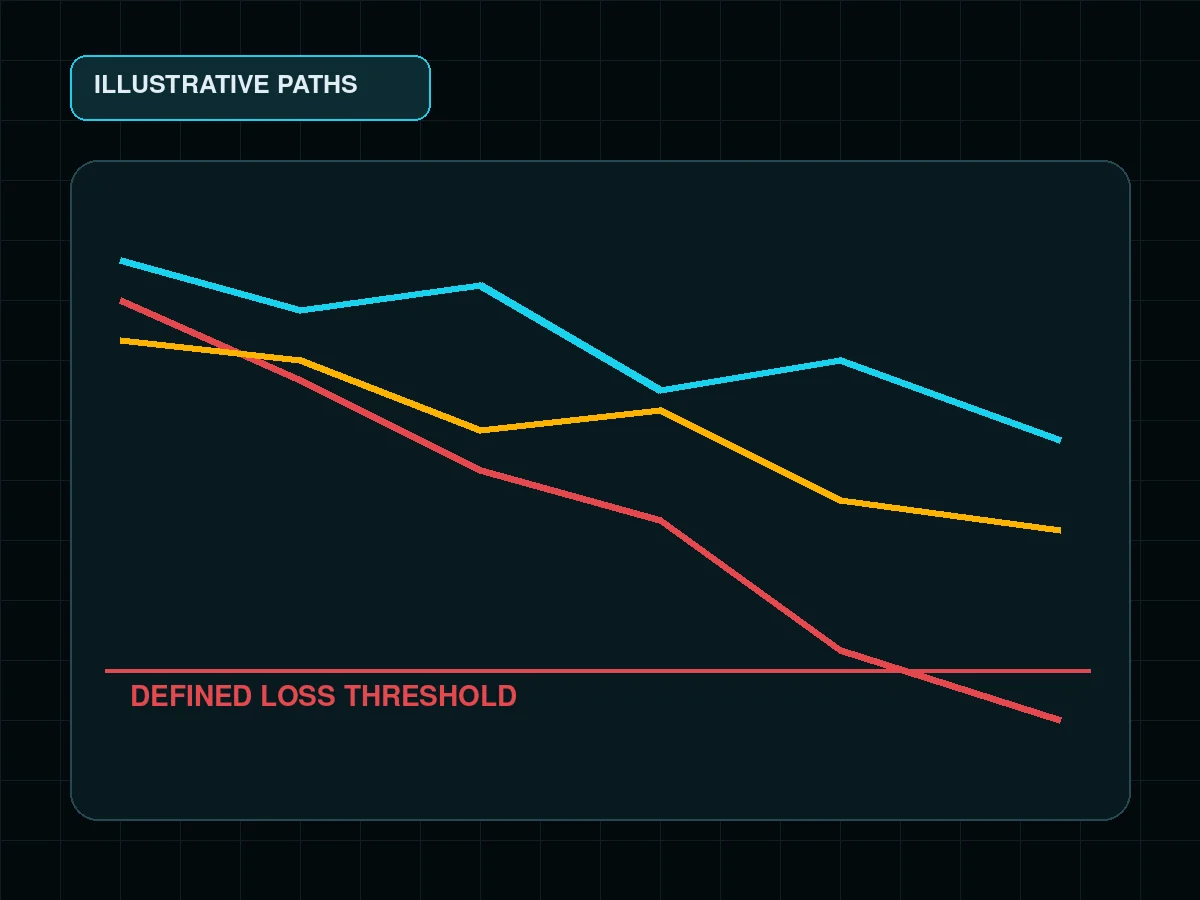
A stop-loss goes where your trade idea stops working, not where the loss "feels acceptable". Three practical ways to find that place: beyond the level you are trading from, past the last swing that defines the trend, or by volatility, typically 1.5 to 2 times the ATR. Then size the position so that this stop costs 1-2% of the account. A fixed "minus 2%" stop ignores the chart and gets hit by ordinary noise.
01Method 1: beyond support or resistance#
If you buy at support, you are betting the level holds. The stop goes beyond the level, with room, not on it.
- Long: stop below support.
- Short: stop above resistance.
- Room: enough that an ordinary touch of the level does not close the trade.
Example: support at 100, price has bounced from it twice. A stop at 99.8 gets hit by the next touch. A stop at 98 is hit only by a real breakdown, which is exactly when you want out. How to draw the zone itself is in support and resistance.
02Method 2: past the structure#
An uptrend is a series of higher lows. As long as they keep rising, the trend is alive. A long's stop goes below the last higher low: if that low breaks, the up-structure is broken too.
| Trade | Stop goes past | The idea is broken if |
|---|---|---|
| Long in an uptrend | The last higher low | Price closes below that low |
| Short in a downtrend | The last lower high | Price closes above that high |
| Range breakout | The opposite side of the range | Price falls back inside |
More on reading structure in uptrend and downtrend.
03Method 3: by volatility (ATR)#
Different assets move differently. ATR (Average True Range) is the average size of a candle's full range over a period, usually 14 candles. It tells you how far price moves on an ordinary day for no particular reason.
Here is what that looked like on daily candles at the close of October 21, 2026:
| Asset | ATR(14), share of price | 2 ATR |
|---|---|---|
| Bitcoin | about 2.5% | about 5% |
| Solana | about 4.5% | about 9% |
| NEAR | about 10.2% | about 20% |
A 2% stop sits inside one ordinary day for all three. On NEAR it is a fifth of a normal day's range.
A common rule of thumb is 1.5 to 2 ATR from the entry. The stop ends up beyond normal noise, and the position gets smaller so the dollar risk does not grow. The math is in risk per trade.
04How to stop getting wicked out#
- Avoid round numbers such as 100 or 50,000. That is where the crowd's stops cluster.
- Place the stop beyond a zone, not on a line. A level is an area, not a point.
- Check the higher timeframe. A stop that looks logical on the 15-minute chart may sit in the middle of one daily candle.
- Do not pull the stop closer to improve the ratio. If the honest stop is far away, cut the size or skip the trade.
- On leverage, keep liquidation beyond the stop. If the liquidation price is closer than your stop, the exchange closes you first, at a worse price.
A good stop is hit rarely, and when it is, you know you were wrong. A bad stop is hit often and tells you nothing.
05Putting it together#
Find the point where the idea breaks: the level, the last swing, or about 2 ATR. Add room. Size the position so that this stop costs 1-2% of the account. If, with that stop, the target does not pay at least about twice the risk, skip the trade. There will be another one.
FAQ#
Where should I place a stop when buying at support?
What is ATR and how do I set a stop with it?
Why is a fixed percentage stop a bad idea?
What if the right stop is very far away?
Why does price seem to hunt my stop?

DoberInvest on Telegram
Questions about this guide?Ask in the English channel. That is also where we post charts, the levels we watch and what would change our mind. A system, not signals, and no profit promises.
This guide explains how the mechanics work; what you do with them is your own decision. Trading can lose you money, and leverage makes losses bigger and faster. 18+

Founder of DoberInvest, in the market since 2018. Teaches a system, not signals.