

In this guide 6
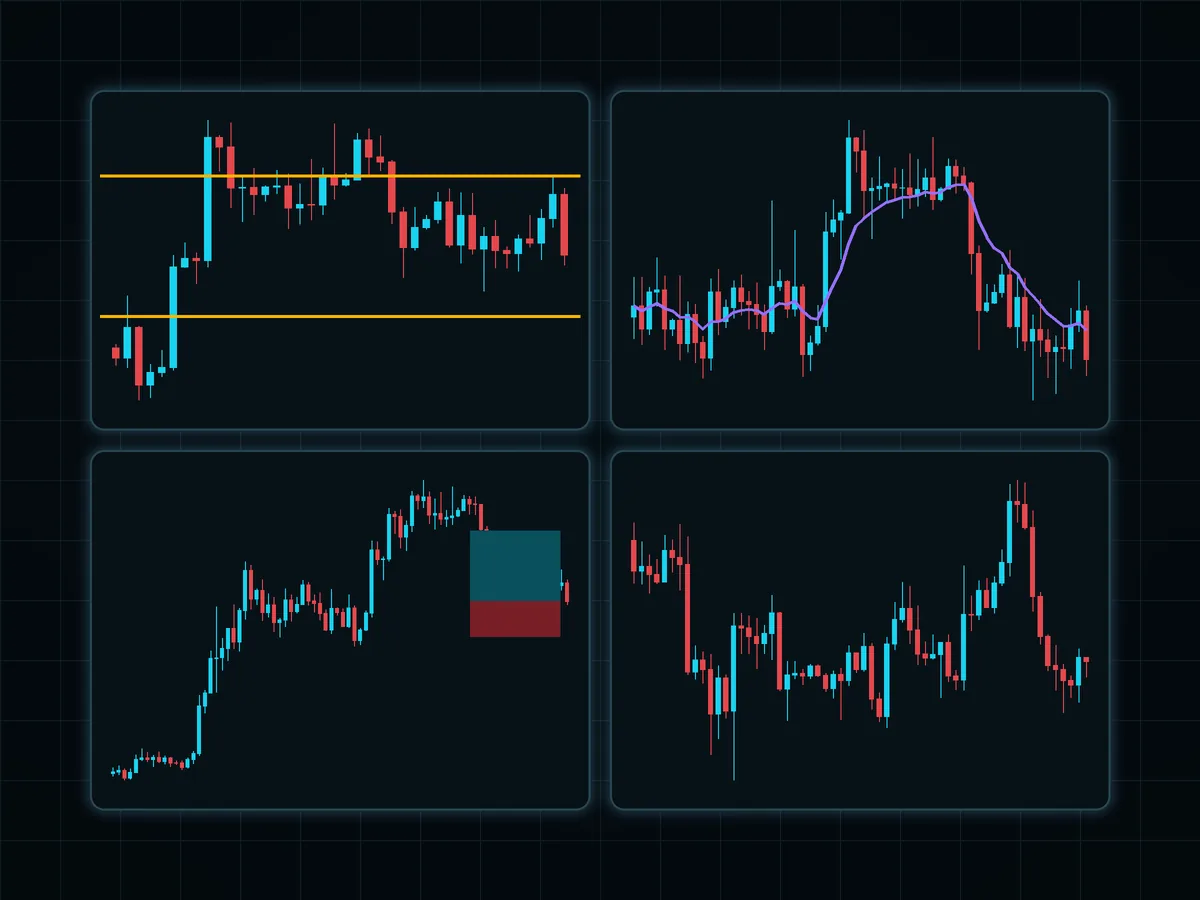
Support is a price area where a falling market tends to stop and bounce, because buyers step in there. Resistance is an area where a rising market tends to stall, because sellers step in. Draw them as zones, not thin lines, from the higher timeframes down. Buy near support, sell near resistance, put the stop beyond the level, and aim for the next level as the target.
01What levels are#
Picture price as a ball bouncing in a room:
- Support is the floor. Price falls, hits it and bounces. Buyers are stronger here.
- Resistance is the ceiling. Price rises, hits it and drops back. Sellers are stronger here.
The more times price has turned at a level, the more traders see it, and the more it matters. Levels work largely because many people watch the same prices and place orders around them.
02How to find levels#
- Start on a higher timeframe: the daily or the 4-hour chart. Levels from higher timeframes carry more weight than anything on the 5-minute chart.
- Find places where price turned several times. Those turns are your levels.
- Draw through the cluster of candle bodies and wicks, not through one random spike.
- Make it a zone, not a line. Give the level room to breathe, a band about as wide as the typical wicks around it.
- Keep only the levels that matter. A chart with twenty lines tells you nothing. Two or three zones above and below the price are enough.
Round numbers often act as levels too, because so many orders cluster at them.
03The role reversal#
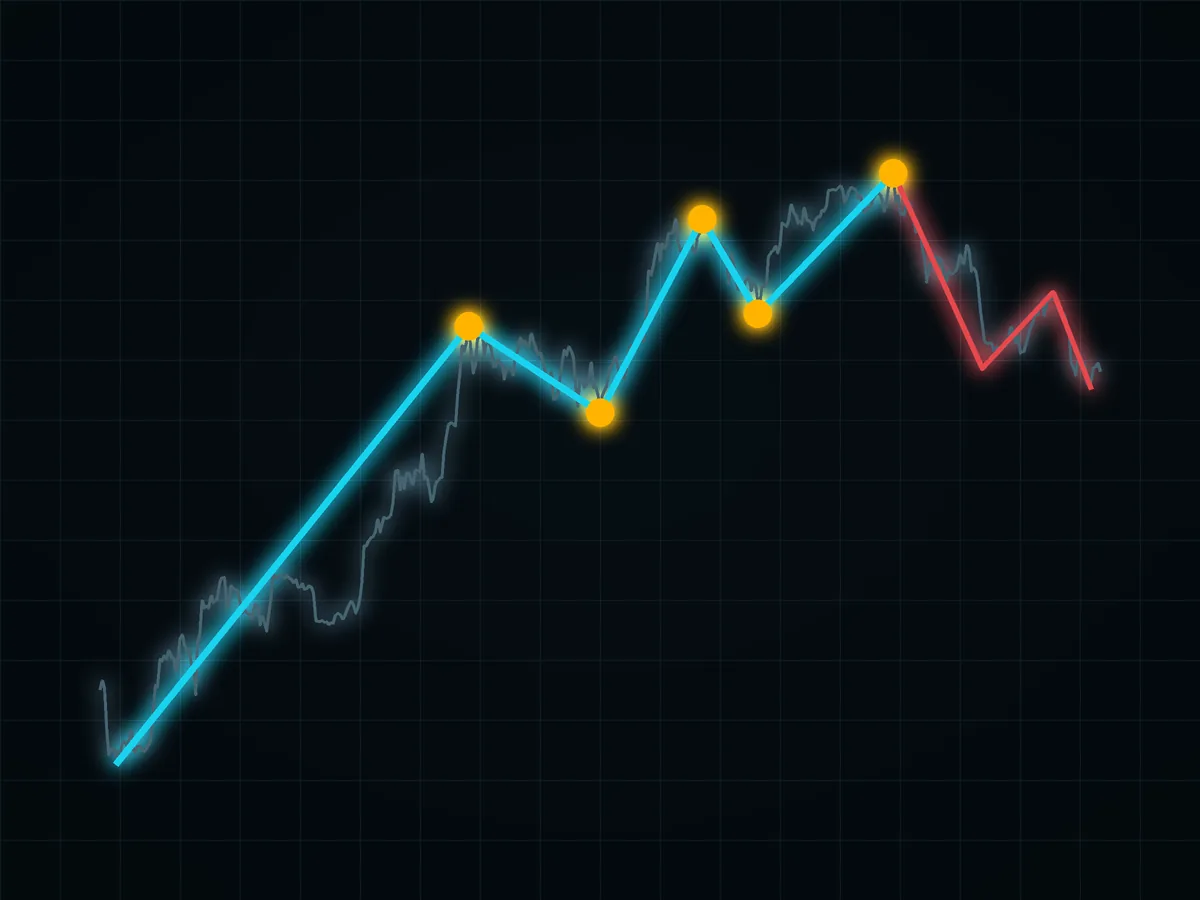
The most useful idea about levels: once resistance is broken and price holds above it, it tends to become support. The same works in reverse for broken support.
Why it happens: traders who sold at that resistance and are now losing, plus traders who missed the breakout, often act at the same price when it returns. The retest of a broken level is one of the clearer places to plan an entry, because the stop can sit just on the other side of it.
04How to use levels in a trade#
- Look for longs near support and shorts near resistance, not in the middle of the range where neither side has an edge.
- Put the stop beyond the level, not on it. A stop right on the line gets taken out by ordinary noise.
- Use the next level as the target. Do not get greedy: the next zone is where the opposite side waits.
- Check the reward against the risk before you enter. If the distance to the stop is as big as the distance to the target, the trade is not worth much.
05Common mistakes#
- Drawing levels on a 1-minute chart and expecting them to hold like daily ones.
- Moving the level to fit the trade after price has already broken it.
- Treating a level as a wall. Levels break, especially after several tests. A level is a place where something is likely to happen, not a promise.
- Confirming with indicators only. An indicator such as RSI can add context near a level, but price action at the level comes first.
Levels are the frame of almost any trade. It sounds dull, and it works because it is dull.
FAQ#
What is support and resistance?
How do I find support and resistance levels?
Why does broken resistance become support?
Where should the stop go?
Is a level a line or a zone?

DoberInvest on Telegram
Questions about this guide?Ask in the English channel. That is also where we post charts, the levels we watch and what would change our mind. A system, not signals, and no profit promises.
This guide explains how the mechanics work; what you do with them is your own decision. Trading can lose you money, and leverage makes losses bigger and faster. 18+

Founder of DoberInvest, in the market since 2018. Teaches a system, not signals.