

In this guide 5
RSI (Relative Strength Index) is a momentum gauge on a 0-100 scale. It compares the size of recent up-moves with recent down-moves, usually over 14 candles. Above 70 is called "overbought", below 30 "oversold". The useful part is not those lines but divergence, when price and RSI disagree. Overbought is not a sell call: on Bitcoin's daily chart, readings above 70 were more often followed by higher prices than lower ones.
01What RSI is#
RSI was introduced by J. Welles Wilder in 1978. It looks at the last N candles (14 by default), works out whether gains or losses dominated and how strongly, and turns that into one number from 0 to 100. Think of it as a speedometer for the move.
- RSI rising: buyers are pushing harder.
- RSI falling: sellers are stronger.
- Around 50: balance, nobody is pulling hard.
The formula is short:
RS  = average gain ÷ average loss (last 14 candles)
RSI = 100 − 100 ÷ (1 + RS)
If the average gain equals the average loss, RS is 1 and RSI is exactly 50. If there were only gains, RSI goes to 100.
02The 70 and 30 lines#
RSI has two famous lines: 70 above and 30 below.
- Above 70, "overbought": the recent move up has been strong and fast.
- Below 30, "oversold": the recent move down has been strong and fast.
The trap: overbought does not mean "about to turn". It means "has been strong". We checked Bitcoin's daily chart from January 2018 to October 22, 2026, about 3,200 days:
| Daily RSI(14) | Days | BTC higher 30 days later | Median 30-day change |
|---|---|---|---|
| Above 70 | 329 | 79% | +11.3% |
| 30 to 70 | 2,706 | 51% | +0.3% |
| Below 30 | 137 | 64% | +2.0% |
High RSI showed up mostly inside strong uptrends, and those trends tended to continue. The longest unbroken run above 70 lasted 25 days, starting October 20, 2023. Anyone selling "because RSI is overbought" on day one gave up most of that move.
03Divergence: what RSI is actually good for#
The most useful thing in RSI is divergence, when price and RSI point in different directions.
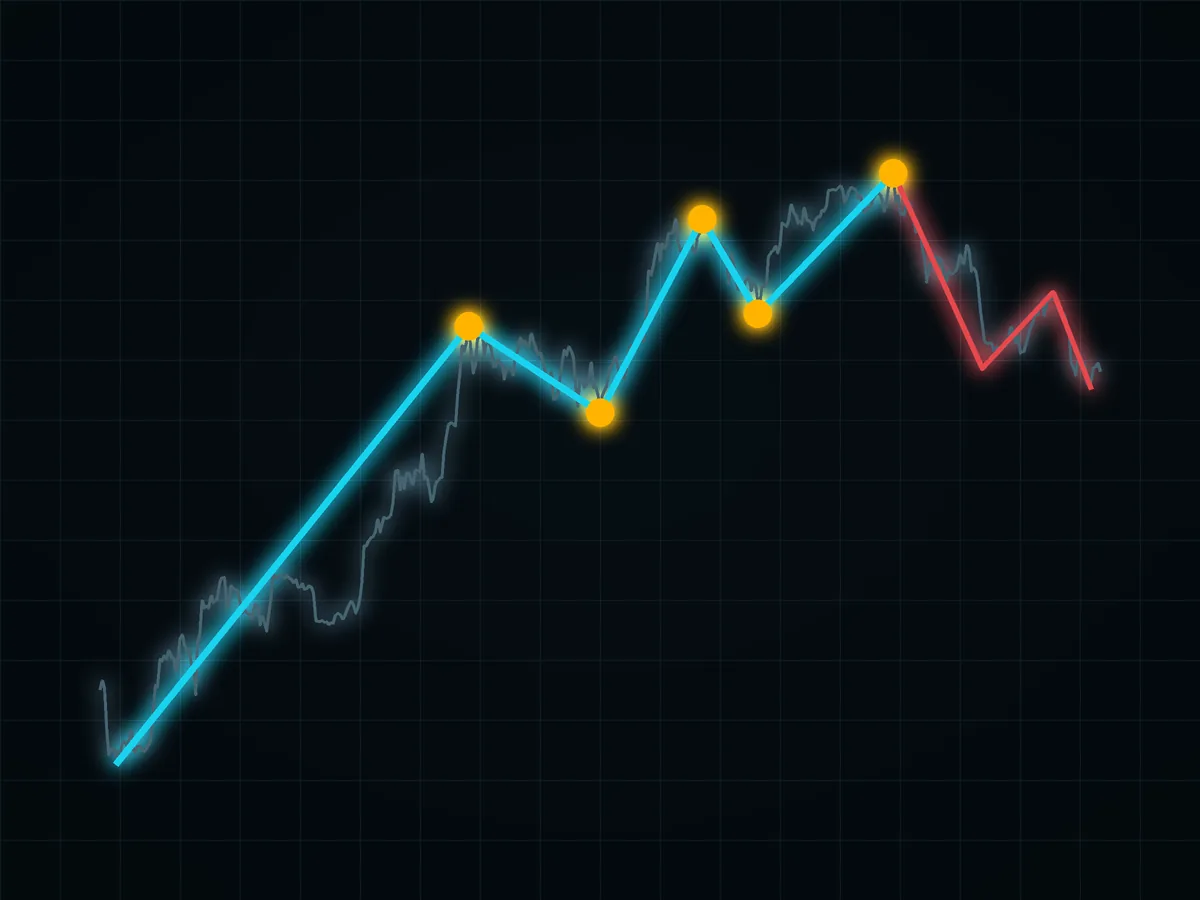
- Bearish divergence: price makes a higher high, RSI makes a lower high. Price is climbing, but the force behind the move is fading.
- Bullish divergence: price makes a lower low, RSI makes a higher low. The decline is losing steam.
A divergence is a warning, not an entry. It can repeat two or three times before price turns, so it needs confirmation from price itself: a broken level or a clear reversal candle.
04How to use RSI honestly#
- In a range, the 70/30 lines work reasonably well: near 30, look for a bounce at support; near 70, look for weakness at resistance. How to find those levels is in support and resistance.
- In a trend, forget 70/30 as a trigger. Watch for divergence plus confirmation from a candle or a level.
- Never enter on RSI alone. It confirms mood. The order is: trend, level, candle, then RSI as a check.
- Size the trade before you act on any indicator. The stop goes where the idea is wrong, and the position size comes from that, as shown in risk per trade.
RSI lags, and it misleads in strong trends. It is a compass for mood, not a buy button. Whoever trades on one oscillator alone is feeding the market.
FAQ#
What does RSI measure?
Does RSI above 70 mean I should sell?
What is RSI divergence?
What RSI settings should I use?
Does RSI work in a range?

DoberInvest on Telegram
Questions about this guide?Ask in the English channel. That is also where we post charts, the levels we watch and what would change our mind. A system, not signals, and no profit promises.
This guide explains how the mechanics work; what you do with them is your own decision. Trading can lose you money, and leverage makes losses bigger and faster. 18+

Founder of DoberInvest, in the market since 2018. Teaches a system, not signals.