
In this guide 11
To use TradingView, open a chart from the search bar, pick a candlestick chart and a timeframe, mark decision levels, add only indicators you understand, set useful alerts and save the layout. That is a complete working setup. Everything else on the platform is optional.
The trap is adding every available indicator and drawing until price disappears. The workflow below starts with the market question and adds a tool only when it answers that question.
01Start with the free plan#
The free plan is enough to learn symbol search, chart types, drawing tools, indicators, alerts, paper trading and layout discipline. Exact plan limits and paid prices are mutable product facts. Check TradingView's official pricing page on the day a limit matters instead of copying a comparison table from an article.
Illustrative clean-chart model: assume 1 chart, 2 complementary indicators and 3 planned alert levels. These are invented workflow limits, not TradingView plan limits. The point is to force every visible element to earn its place.
02Step 1. Open the right chart#
- Search the symbol in the top bar: type BTCUSDT and pick the exchange you actually trade on. Prices and volume differ slightly between venues, and your alerts should fire on the prices you trade.
- Choose candles. The chart-type button in the top toolbar; Japanese candlesticks show open, high, low and close.
- Pick a timeframe that matches how long you expect to hold the trade. Start with a broad context chart, then move to the planning timeframe.
- Turn on log scale for long histories (Alt+L). A log chart compares percentage changes more naturally than equal dollar distances.
03Step 2. Mark the levels first#
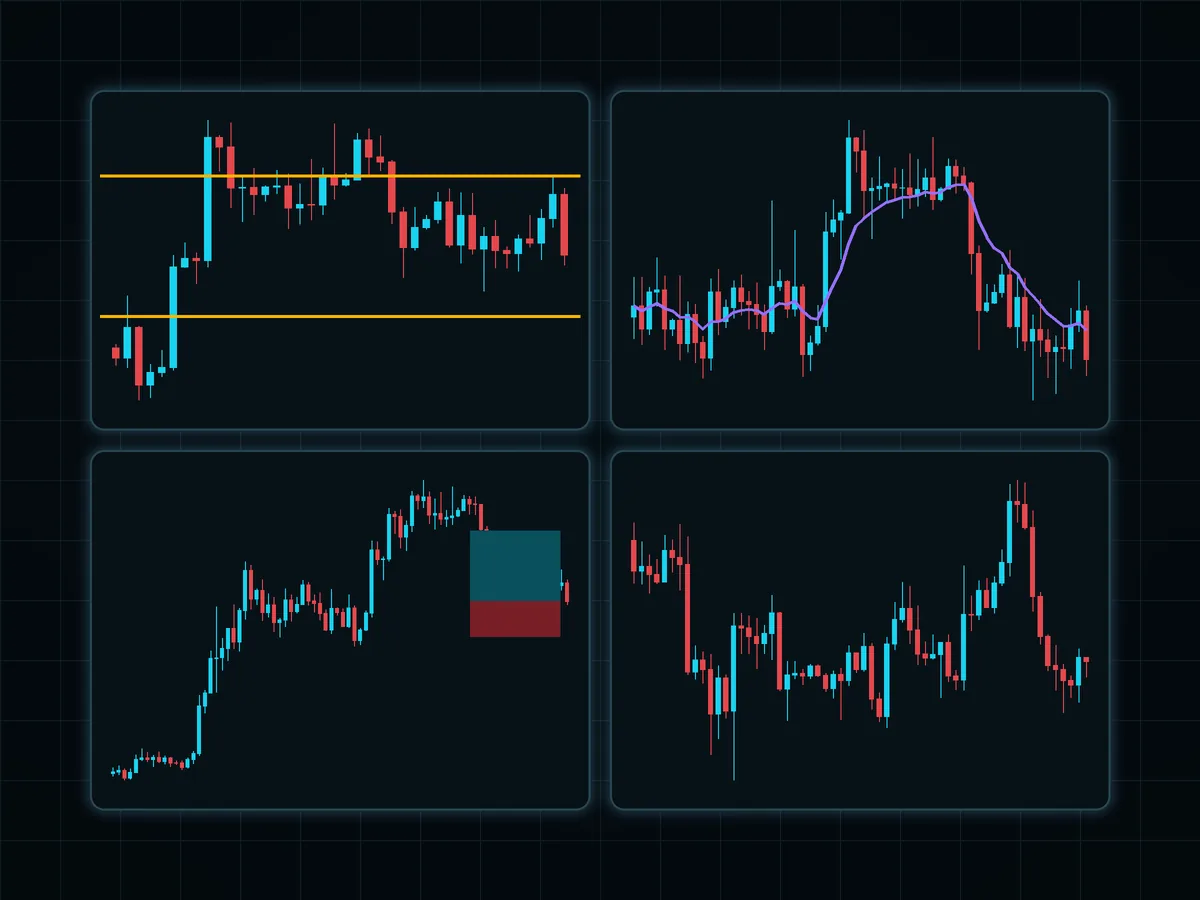
Levels come before indicators. With the horizontal line tool (Alt+H) mark:
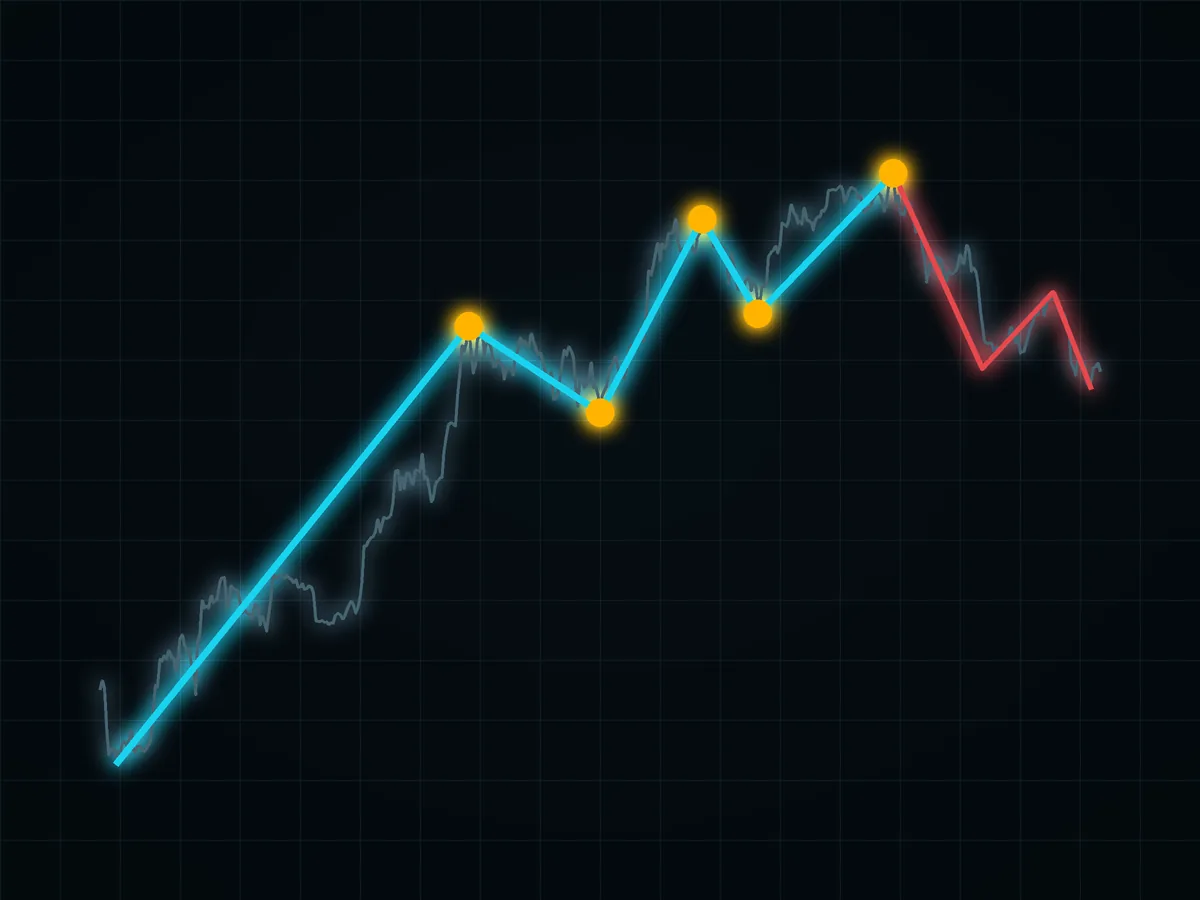
- the recent swing highs and lows on the context chart;
- any price where the market turned several times;
- the range the market is trading in now.
How to choose them is in support and resistance. A few well-chosen lines beat a crowded grid. Use distinct styles for context and planning levels so you know which is which.
For pullbacks you can use the Fibonacci tool (Alt+F), as long as you read it as a ruler, not a magnet; the Fibonacci retracement guide explains the arithmetic and its limits.
04Step 3. Make each indicator answer a different question#
Pick tools that answer different questions:
| Question | One good choice | Why |
|---|---|---|
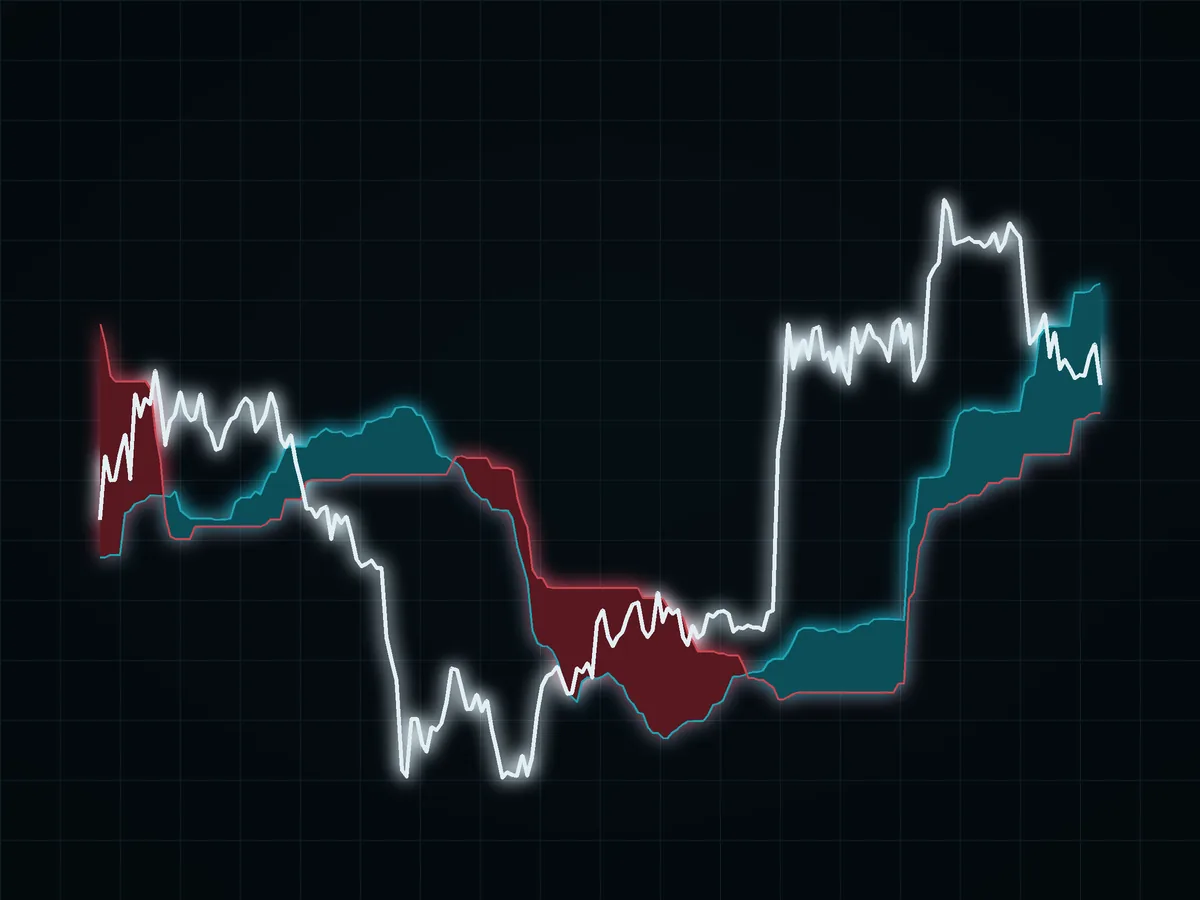
| Which way is the trend? | a long-term moving average, or the Ichimoku Cloud | one trend filter is enough |
| How strong or tired is the move? | RSI or MACD | momentum, read with the trend |
| How volatile is it now? | Bollinger Bands | sizes your stop |
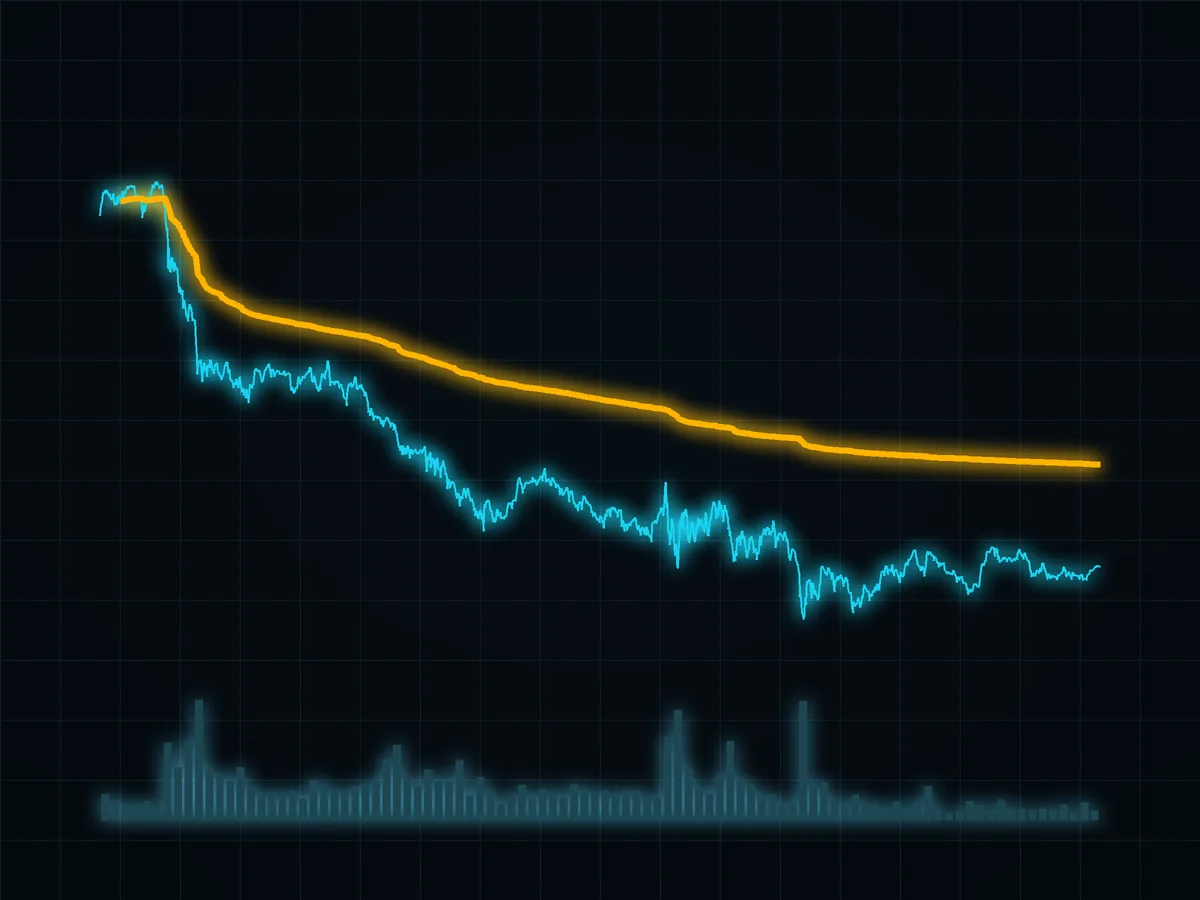
| Where did volume trade? | volume or VWAP for intraday | context for levels |
Avoid stacking tools from the same row: MACD, RSI and a moving-average crossover can repeat one message. Press "/" on the chart to open the indicator search.
05Step 4. Let alerts watch the levels#
Right-click a line and choose Add alert, or press Alt+A. Set the condition to "crossing" and choose app or email notifications. Then close the chart. The point of alerts is that you stop staring at candles and come back only when price reaches a level where you have a plan.
Treat alerts as scarce attention: use them only at levels where you would actually act.
06Step 5. Plan the trade on the chart#
The long and short position tools draw entry, stop and target as boxes and show the ratio. Use them to check the trade before you place it:
- stop beyond the level that proves you wrong;
- target before the next level against you;
- read the ratio and compare it with the win rate it needs (risk reward ratio);
- size the position from the stop (position size calculator).
If you trade futures, the order of decisions (stop, size, then leverage) is in how to trade crypto futures.
07Step 6. Practice with Bar Replay and paper trading#
Bar Replay hides the right side of the chart and plays it forward candle by candle. Availability and timeframe limits can change by plan, so check the product interface. Pick a past date, mark levels without seeing the outcome and play forward. Repeated replay practice is more useful than studying only finished charts because it reduces hindsight.
Paper trading lets you place virtual orders on the chart. Use it to learn the order types and the habit of setting stops, not to prove a strategy: virtual fills are kinder than real ones.
08Step 7. Save the layout and keep a journal#
Save the layout. Take a snapshot of every planned trade (Alt+S) and paste it into your trading journal with the reason, stop and outcome. After a meaningful sample, the journal will tell you more about your use of TradingView than any feature list.
09Common mistakes#
- Indicator soup. If you need a pile of tools to see the trend, there may be no clear trend.
- Charting one exchange, trading another. Wicks and alerts differ between venues.
- Drawing on the smallest chart first. Start from broad context, then zoom in.
- Trusting other people's published ideas. They are opinions with a chart attached.
- Paying before you hit a limit. Upgrade when a limit actually stops your process, not before.
TradingView is a workbench. Keep the chart clean, make each tool answer a specific question and use the same review process consistently. The upgrade decision can wait until a current documented limit genuinely gets in your way.
10Primary references#
FAQ#
Can you use TradingView for free?
How do I set an alert on TradingView?
Does TradingView use real money?
Is TradingView good for beginners?
How much does TradingView cost?

DoberInvest on Telegram
Questions about this guide?Ask in the English channel. That is also where we post charts, the levels we watch and what would change our mind. A system, not signals, and no profit promises.
This guide explains how the mechanics work; what you do with them is your own decision. Trading can lose you money, and leverage makes losses bigger and faster. 18+

Founder of DoberInvest, in the market since 2018. Teaches a system, not signals.