
In this guide 8
MACD indicator
The moving average convergence divergence indicator, or MACD, compares two exponential moving averages of price. It can summarize trend direction and changes in momentum, but it cannot establish a trade's future return by itself.
This guide explains the standard calculation and a transparent numerical model. It makes no performance claim because no retained, source-verifiable backtest supports one here.
01Standard components#
TradingView's official indicator documentation describes the common default settings as 12, 26 and 9 periods:
MACD line = 12-period EMA − 26-period EMA
smoothing line = 9-period EMA of the MACD line
histogram = MACD line - smoothing line
An exponential moving average gives more weight to recent observations than a simple moving average. The selected price field and timeframe therefore matter: a daily close calculation is not interchangeable with an hourly calculation.
02Worked numerical model#
Assume an invented MACD model with a 12-period EMA of 105, a 26-period EMA of 100, and a smoothing line of 3. These are not market observations.
The model inputs are:
- modeled 12-period EMA: 105;
- modeled 26-period EMA: 100;
- modeled smoothing line: 3.
The MACD line is:
105 − 100 = 5
The histogram is:
5 − 3 = 2
The positive MACD line means the modeled fast EMA is above the modeled slow EMA. The positive histogram means the MACD line is above its modeled smoothing line. Neither statement is a price forecast.
Now assume an invented later model with a fast EMA of 101, a slow EMA of 100, and a smoothing line of 2:
- the fast EMA is 101;
- the slow EMA is 100;
- the smoothing line is 2.
Then:
MACD = 101 − 100 = 1
histogram = 1 − 2 = -1
The fast EMA remains above the slow EMA, so MACD is still positive, but the histogram has turned negative because MACD is below its smoothing line. This illustrates why the zero line and smoothing-line crossover answer different questions.
03Reading the zero line#
- MACD above zero: the selected fast EMA is above the selected slow EMA.
- MACD below zero: the selected fast EMA is below the selected slow EMA.
- MACD near zero: the two EMAs are close together.
These are identities from the formula. Calling one state bullish or bearish adds an interpretation that should be tested for the instrument, timeframe and cost assumptions in question.
04Reading the smoothing line and histogram#
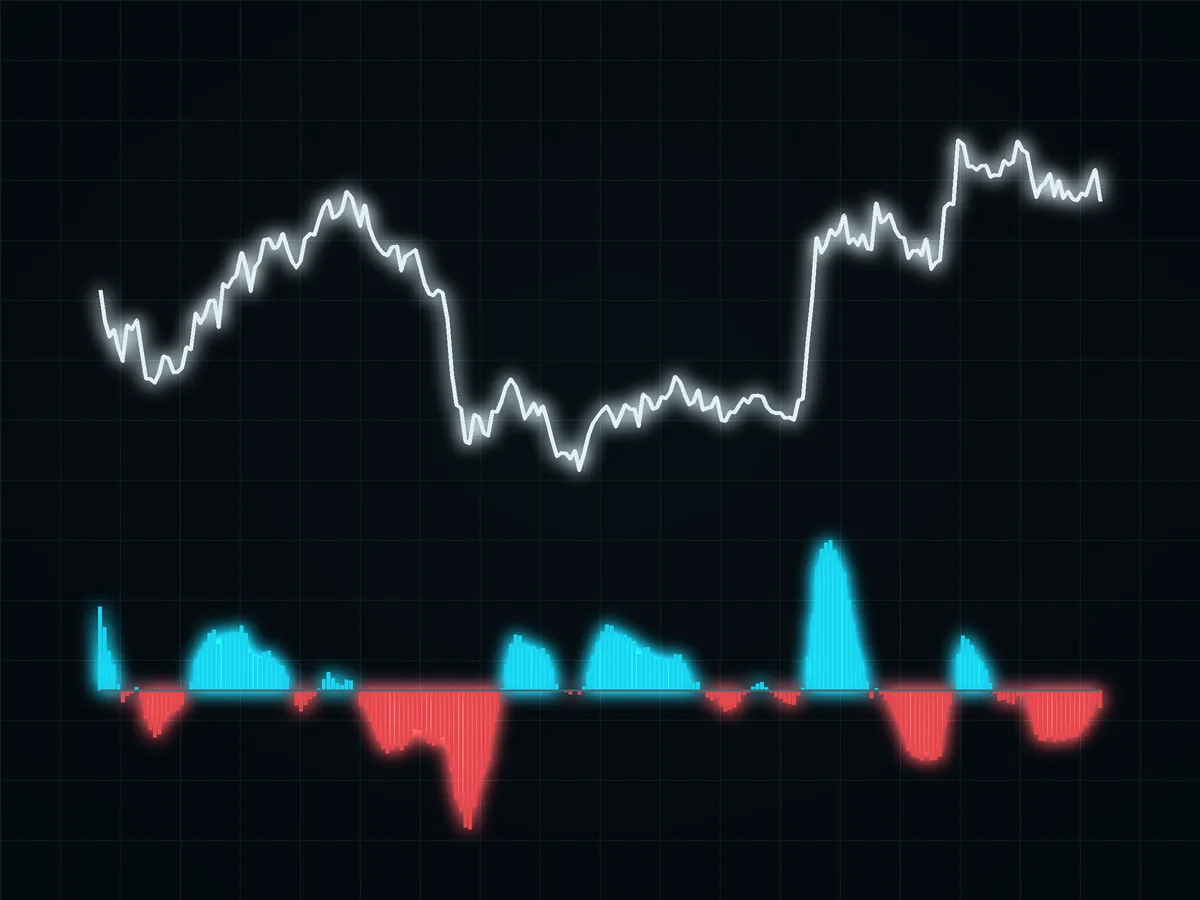
A move of MACD above its smoothing line is often called a bullish crossover; a move below is often called bearish. The histogram visualizes the same difference, so it is not an independent confirmation.
Growing positive bars mean MACD is moving farther above the smoothing line. Shrinking positive bars mean the gap is closing. A shrinking histogram can precede a crossover, but it does not prove one will occur.
05Why MACD lags#
MACD is built from moving averages of past prices, and its smoothing line smooths MACD again. That construction filters some short-term noise while delaying the response to a turn.
Changing the settings changes the trade-off:
- shorter EMA periods respond sooner and can fluctuate more;
- longer periods respond more slowly and smooth more variation;
- a shorter smoothing period tracks MACD more closely.
Settings must always be reported with the input price and timeframe. “MACD worked” is not reproducible without those details, entry and exit rules, costs and raw data.
06A responsible test specification#
Before assessing a MACD rule, define:
- instrument, venue and source;
- timeframe and timezone;
- input price field;
- EMA and smoothing settings;
- exact crossover timing;
- execution assumption and fees;
- comparison benchmark;
- training and out-of-sample periods.
Save the raw input data and calculation code. A chart screenshot or a final return figure is not enough to reproduce a result.
07Sources#
Educational material, not investment advice. Numerical examples are invented models and do not report historical performance.
FAQ#
What does MACD show?
How is the MACD histogram calculated?
What is a bullish MACD crossover?
Is MACD a lagging indicator?

DoberInvest on Telegram
Questions about this guide?Ask in the English channel. That is also where we post charts, the levels we watch and what would change our mind. A system, not signals, and no profit promises.
This guide explains how the mechanics work; what you do with them is your own decision. Trading can lose you money, and leverage makes losses bigger and faster. 18+

Founder of DoberInvest, in the market since 2018. Teaches a system, not signals.