
In this guide 7
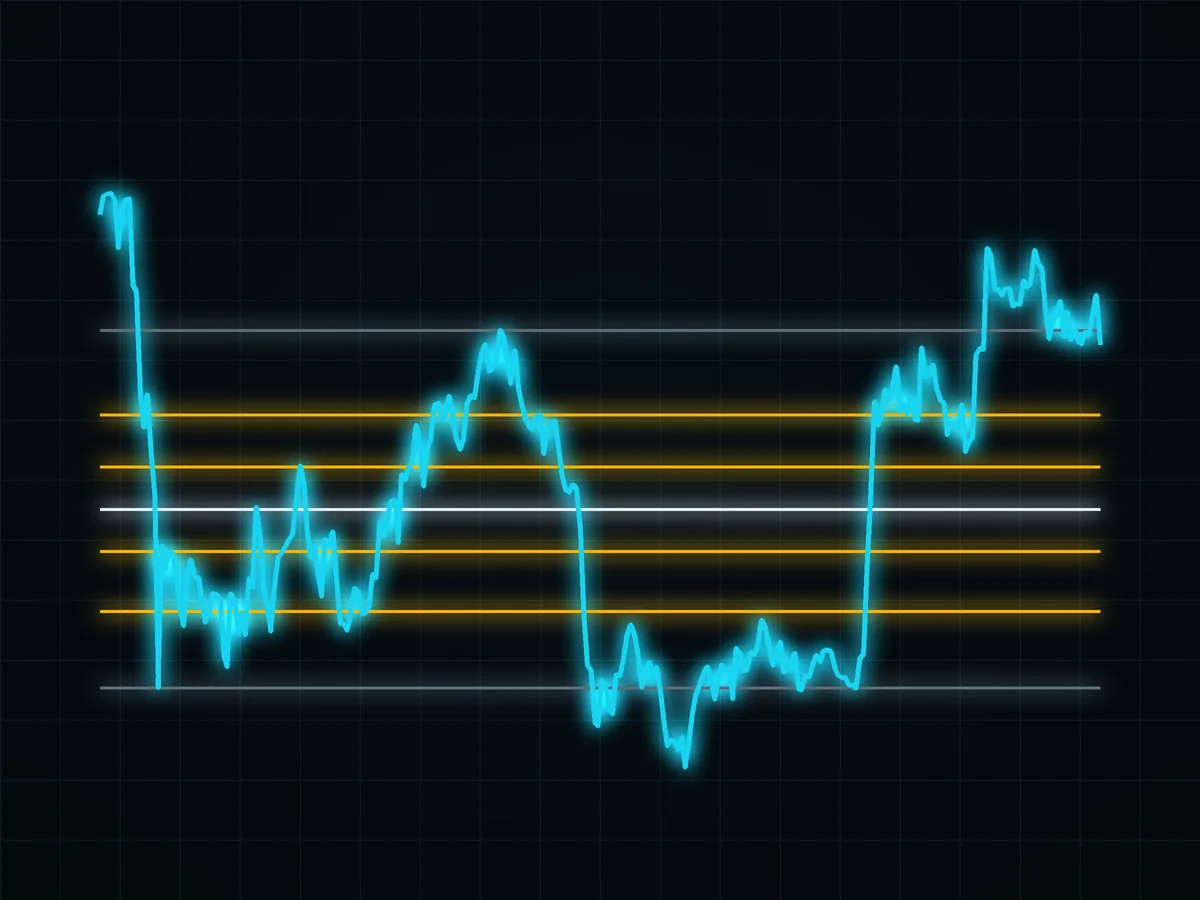
A Fibonacci retracement splits a price swing into reference ratios and draws a horizontal line at each. TradingView's official drawing-tool documentation lists 23.6%, 38.2% and 61.8% among its key internal levels, and the tool also allows custom levels. Drag it between the two extremes of a completed swing and the lines show how deep a pullback has gone. The tool is a ruler, not evidence that price must reverse.
01How to draw it#
- Find a finished swing. A clear low and a clear high with a visible move between them. Small wiggles give meaningless lines.
- Drag in the direction of the move. Uptrend: from the low to the high. Downtrend: from the high to the low.
- Read the levels as depth. A displayed percentage describes how much of the selected swing has been retraced.
- Decide in advance what would prove you wrong. Use market structure or the swing extreme; no ratio proves that a reversal has begun.
Platforms may enable different default or custom levels. Treat the visible configuration on your own chart as the source of truth and record it with the trade plan.
02Worked pullback model#
Illustrative Fibonacci model: assume a swing low of $100, a swing high of $140 and a retracement ratio of 0.50. The swing is $40. A halfway pullback is $20, so the model level is $120.
Swing = $140 - $100 = $40
Pullback = $40 x 0.50 = $20
Level = $140 - $20 = $120
This is invented arithmetic, not a live setup. Change the anchors and every level changes. The calculation tells you where a ratio lies; it does not estimate the probability of a bounce.
03So why do traders keep using it?#
Because it is useful for things other than prediction.
- It gives a common language. A stated pullback depth is clearer than saying price moved "a lot."
- It frames risk. If a pullback zone aligns with structure, you can place invalidation beyond that structure and calculate the position from the stop distance.
- It marks depth consistently. A deep retracement is visibly different from a shallow one even when neither predicts the next move.
- It can line up with real levels. When a configured ratio sits on old support or a high-volume area from a volume profile, the level matters because of the market structure, not because the ratio predicts a turn.
04How to use it without fooling yourself#
- Treat the levels as a zone, not a line. A single calculated price is not predetermined support.
- Wait for price to confirm. A rejection candle or a reclaimed level at the zone, read with Japanese candlesticks, tells you more than the ratio.
- Put the stop where the idea fails. Use market structure or the swing extreme, not a ratio in isolation. See where to place a stop-loss.
- Check the trend first. Retracements assume a trend. In a range, the lines are drawn on noise (uptrend and downtrend explains how to tell).
- Size from the stop, then choose leverage. The order of operations is in how to trade crypto futures.
05Common mistakes#
- Redrawing the tool until a line fits. With several lines and a choice of swings, something will always fit in hindsight.
- Buying the first touch of a ratio. A level is not a reason; a reaction at the level is.
- Using tiny swings. Lines drawn on noise carry no useful context.
- Treating a halfway or custom level as a law. A configured ratio is still only a reference.
Fibonacci retracement is a tidy way to measure a pullback and plan a decision. Keep the ruler, state the anchors and stop expecting the marks to hold price by themselves.
06Primary reference#
FAQ#
How do you draw a Fibonacci retracement?
What are the key Fibonacci retracement levels?
Does Fibonacci retracement work?
Does Fibonacci retracement work in crypto?
What is the golden zone in Fibonacci retracement?

DoberInvest on Telegram
Questions about this guide?Ask in the English channel. That is also where we post charts, the levels we watch and what would change our mind. A system, not signals, and no profit promises.
This guide explains how the mechanics work; what you do with them is your own decision. Trading can lose you money, and leverage makes losses bigger and faster. 18+

Founder of DoberInvest, in the market since 2018. Teaches a system, not signals.