

In this guide 6
A trend is the direction of price, read from market structure. In an uptrend each swing low is higher than the one before, and each swing high is higher too. In a downtrend each high is lower than the previous high, and each low lower. Define the trend on a higher timeframe first, trade in its direction, and treat a single broken low or high as a warning, not a reversal.
01Bull and bear#
There are only two directions:
- Bullish: price goes up. The bull tosses price up with its horns.
- Bearish: price goes down. The bear swipes it down with its paw.
It sounds like a joke, but the picture helps you keep the direction straight under pressure.
02How to read trend from structure#
Look at how price makes its swing highs and swing lows:
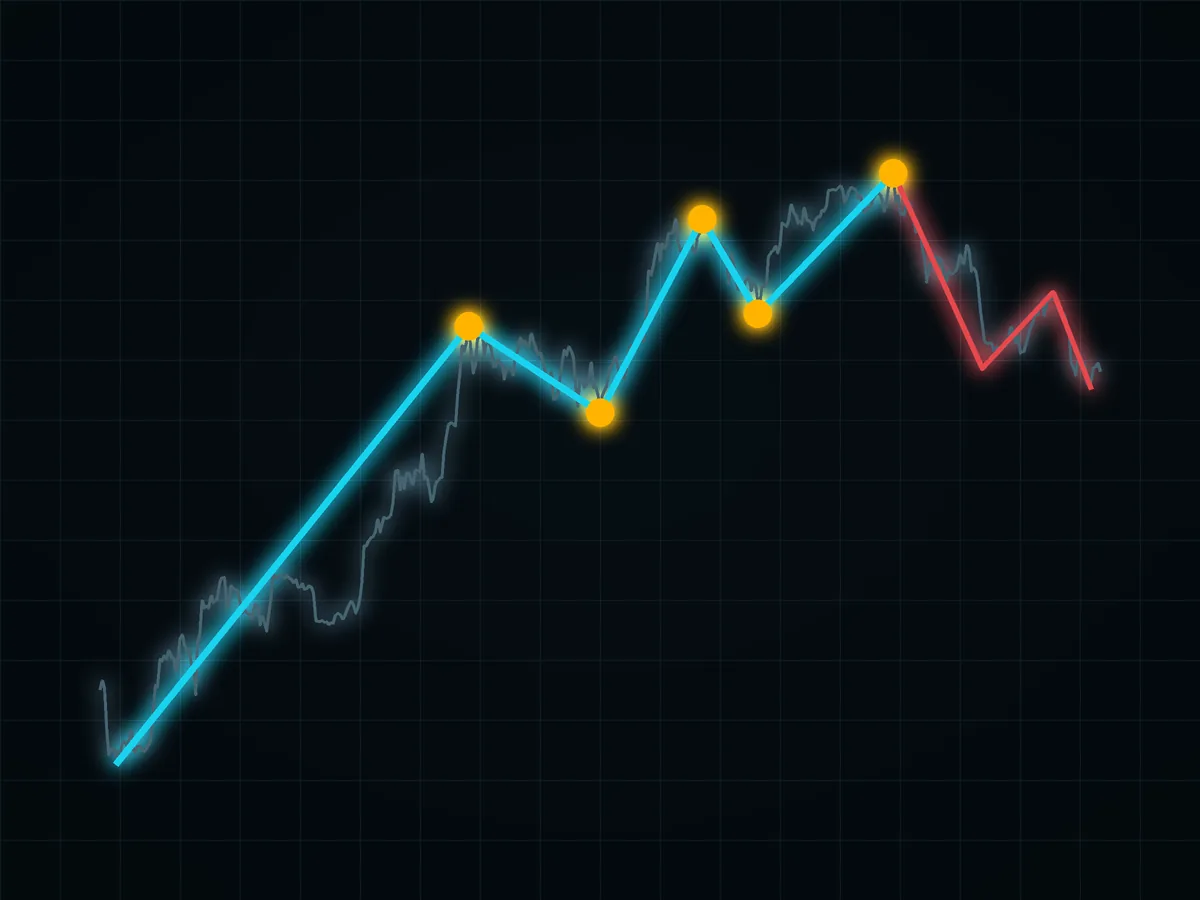
- Uptrend: higher highs (HH) and higher lows (HL). Price climbs in steps.
- Downtrend: lower highs (LH) and lower lows (LL). Steps down.
- Range: highs and lows at roughly the same levels. No trend.
The key line: no higher lows, no uptrend. A falling market that "looks cheap" is not a bargain by itself. It is just falling.
03The higher timeframe wins#
Trends exist on every timeframe: a local one on minute charts, a broader one on the hourly, daily and weekly charts. The rule is simple:
- Open the higher timeframe first and define the main trend there.
- Then move down to the timeframe you actually trade.
- If the two disagree, the higher one carries more weight.
A local bounce against the higher-timeframe trend is a classic trap. You buy "the reversal", and it turns out to be a pullback inside a bigger move down.
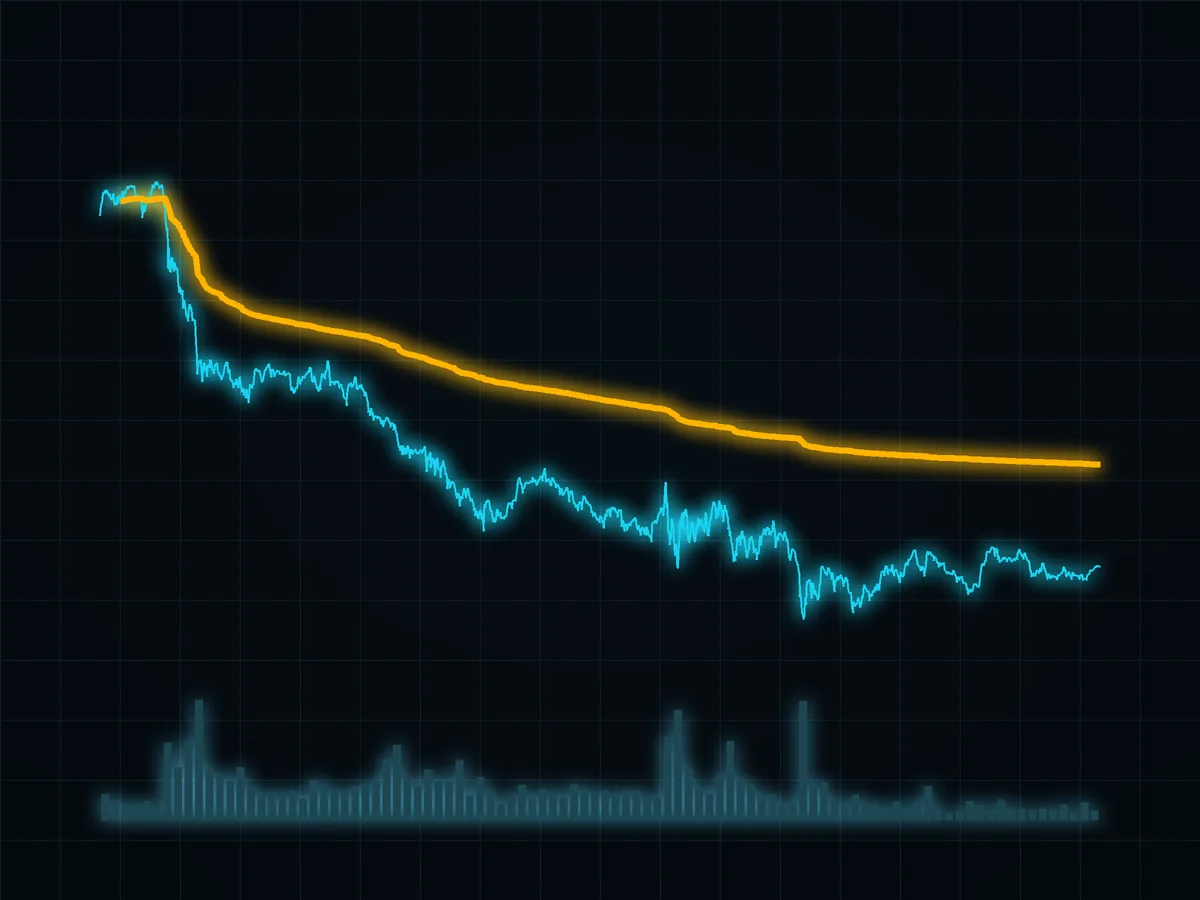
Many traders also use the 200-day moving average as a quick regime check: above it, they favor longs; below it, shorts or cash. See moving averages for what that line did on Bitcoin.
04When the trend has really changed#
One broken low is not a reversal yet. A change of trend needs the structure to flip:
- For a turn up: the lows stop falling, a series of higher lows forms, and price breaks the last lower high.
- For a turn down: the mirror image with the highs.
Until then you are still inside the old trend, and the higher-probability trades are in its direction, not attempts to catch the exact bottom.
05What to do with it#
The system is simple and dull, which is why it works:
- Define the main trend on the higher timeframe.
- Trade with it, not against it.
- Look for entries on pullbacks: to support in an uptrend, to resistance in a downtrend. How to draw those zones is in support and resistance.
- Not sure of the direction? Stay out. No trend, no trend trade.
- Size every position by the stop, as in risk per trade, so that being wrong about the trend costs a planned amount.
That is the difference between "I guessed right" and "I have a system". You can guess for a long time. Working by a system is the better way to spend it.
FAQ#
How do I identify an uptrend?
Which timeframe defines the trend?
When has a trend really changed?
What if there is no clear trend?
Why not buy when price looks cheap?

DoberInvest on Telegram
Questions about this guide?Ask in the English channel. That is also where we post charts, the levels we watch and what would change our mind. A system, not signals, and no profit promises.
This guide explains how the mechanics work; what you do with them is your own decision. Trading can lose you money, and leverage makes losses bigger and faster. 18+

Founder of DoberInvest, in the market since 2018. Teaches a system, not signals.