

In this guide 7
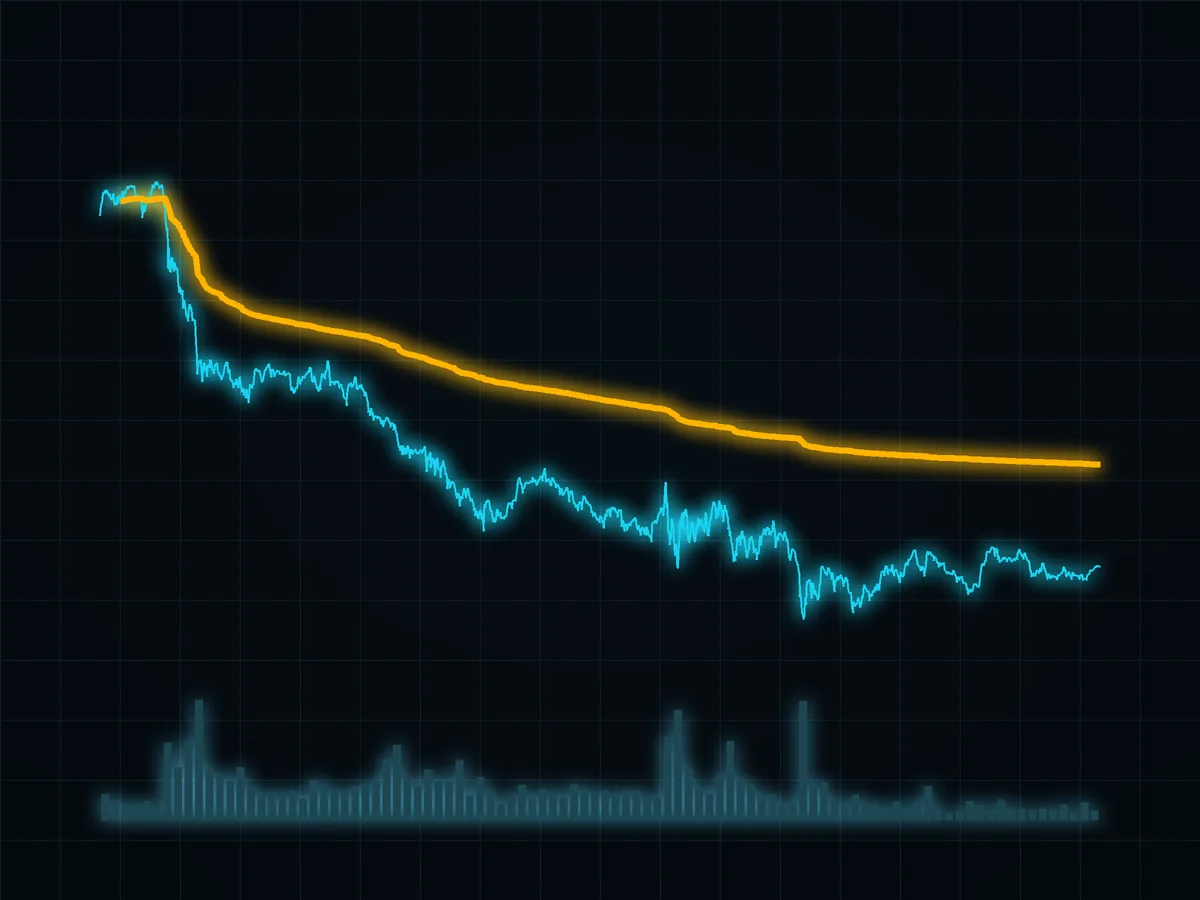
A moving average is the average price of the last N candles, drawn as a line. It smooths out noise and shows direction. A simple moving average (SMA) weights every candle equally; an exponential one (EMA) weights recent prices more and reacts faster. The 200-day average is the most watched trend filter in markets. Every average trades smoothness for lag, so none is perfect, and none should be traded on its own.
01How a moving average works#
Take the last 20 closes, average them, move one candle forward, repeat. The line "slides" along the chart. It does two jobs: it smooths price so you see the trend instead of the ripples, and it acts as a moving level that price often reacts to.
The trade-off never goes away: the smoother the line, the later it reacts. A long period gives a calm line that turns late. A short period turns quickly and twitches on noise.
02Eight types, compared#
| Type | How it weights prices | Lag | Smoothness | Typical use |
|---|---|---|---|---|
| SMA, simple | Equal weight | High | High | Long-term trend filter |
| EMA, exponential | More weight to recent | Medium | Medium | Balance of speed and calm; the base of MACD |
| WMA, weighted | Linear: newest heaviest | Below medium | Medium | An alternative to EMA |
| RMA or SMMA, Wilder | Long memory | High | Very high | Inside RSI, ATR and ADX |
| HMA, Hull | Combination of WMAs | Low | High | Fast entries on lower timeframes |
| VWMA, volume-weighted | Bigger volume, bigger weight | Varies | Medium | Checking whether volume backs the move |
| DEMA, double EMA | Cancels part of EMA lag | Low | Medium | Spotting turns, needs a filter |
| TEMA, triple EMA | Cancels more lag | Very low | Low | Triggers inside a confirmed trend |
The pattern in the table is the trade-off again: every attempt to remove lag adds noise.
03Why everyone watches the 200-day line#
Price above the 200-day SMA is read as a long-term uptrend, below it as a downtrend. That is crude, and it works partly because it is so widely watched: many traders and funds react around the same line, so it often behaves like dynamic support or resistance.
We checked Bitcoin's daily chart from July 2018 to October 22, 2026:
- Bitcoin closed above its 200-day SMA on 54.7% of days.
- Price crossed the line 61 times over that period, so it is no wall.
- 90 days after a close above the line, Bitcoin was higher in 59% of cases (median +6.8%). After a close below, in 52% of cases (median +3.4%).
The edge is modest. The line describes the regime you are in better than it predicts what comes next.
04Golden cross and death cross#
A golden cross is the 50-day average crossing above the 200-day; a death cross is the reverse. On Bitcoin there were 17 crosses between mid-2018 and October 2026, roughly two a year. The most recent golden cross came on September 8, 2026.
Two things to know:
- Crosses are late by design. Both lines are averages of past prices, so by the time they cross, a good part of the move has already happened.
- In sideways markets they flip. The 2020 sequence shows it: a golden cross in February, a death cross in March, another golden cross in May.
05Choosing for your timeframe#
- Long-term and trend-following (daily, weekly): SMA 50 and 200 as regime filters. Lag is a feature here.
- Swing trading (4-hour): EMA 12 and 26, or a faster HMA as a trigger.
- Day trading (1-hour, 15-minute): an SMA 20 as a trend filter, a fast EMA as the entry trigger.
- Scalping (5-15 minutes): fast averages such as HMA, filtered by a slower line, because noise is everywhere.
A working pattern: a slow average for context, so you know the direction, plus a fast one for timing. For example, SMA 50 as the trend filter and EMA 9 for entries.
06How people lose money with averages#
- Trading every crossover in a range. The lines cross back and forth, and each cross is a small loss plus fees.
- Treating a fast average as a holy grail. Less lag means more noise; without a filter it drags you into every twitch.
- One setting for everything. EMA 12 on a 5-minute chart and on a daily chart are different tools.
What works better: use an average as context and a zone, not as a trigger by itself. Combine it with support and resistance and price action at the level, and size every trade by risk per trade. Then backtest the setting on your own asset and timeframe before you trust it with money.
FAQ#
What is the difference between SMA and EMA?
Why is the 200-day moving average important?
What are golden cross and death cross?
Which moving average is best?
Should I trade moving average crossovers?

DoberInvest on Telegram
Questions about this guide?Ask in the English channel. That is also where we post charts, the levels we watch and what would change our mind. A system, not signals, and no profit promises.
This guide explains how the mechanics work; what you do with them is your own decision. Trading can lose you money, and leverage makes losses bigger and faster. 18+

Founder of DoberInvest, in the market since 2018. Teaches a system, not signals.