

In this guide 6
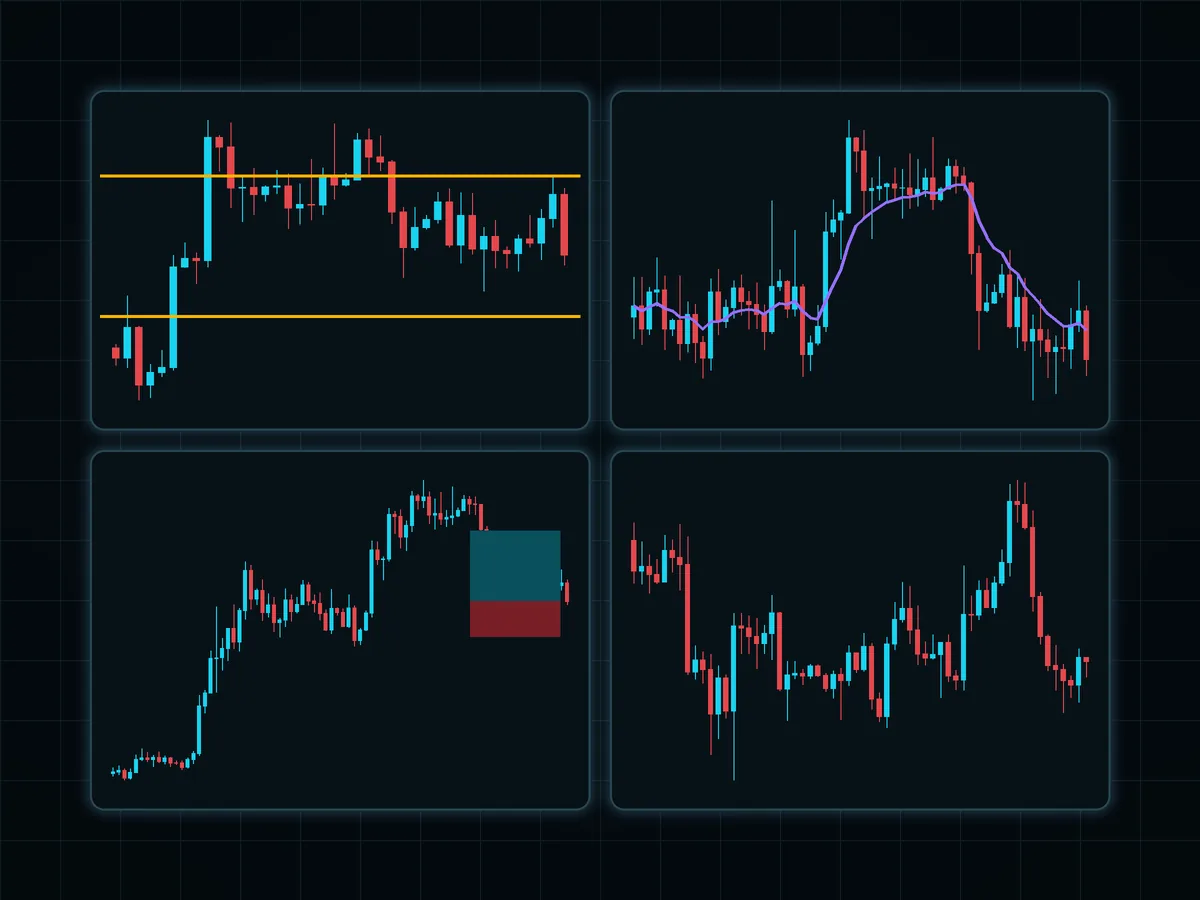
A Japanese candlestick shows four prices for one period: open, high, low and close. The body spans the open and close; the wicks show how far price went but could not hold. A green candle closed higher than it opened, a red one lower. Long bodies mean conviction, long wicks mean rejection. Patterns such as the hammer, engulfing candle and doji only mean something at a level and in the context of the trend.
01Anatomy of a candle#
Candlestick charts come from Japanese rice trading and became widely known among Western traders after Steve Nison's 1991 book on the method. The idea has not changed: one candle compresses a whole period of trading into a shape you can read at a glance.
- Body: the distance between the open and the close.
- Wicks (shadows): where price went but did not stay. The top of the upper wick is the high, the bottom of the lower wick is the low.
- Green (bullish): the close is above the open. Buyers won the period.
- Red (bearish): the close is below the open. Sellers won.
A quick example. A daily candle opens at 100, trades down to 94, recovers and closes at 101. That is a green candle with a small body (100 to 101) and a long lower wick (down to 94). Sellers pushed hard during the day and buyers took it all back by the close.
02What a candle tells you#
- A long body means a confident move: one side controlled the whole period.
- A long wick means price was rejected there. A long lower wick at support says buyers stepped in and pushed sellers back. That is a sign of strength, not just a pretty shape.
- A tiny body with wicks on both sides means neither side won. The market is undecided.
03Three patterns to start with#
There are hundreds of named patterns. A beginner needs three:
| Pattern | What it looks like | What it suggests |
|---|---|---|
| Hammer or pin bar | Small body, one long wick | Price was rejected; a possible turn at a level |
| Engulfing | A large candle whose body covers the previous body | The other side took the initiative |
| Doji | Almost no body | Indecision; the market is pausing |
A hammer at support has a long lower wick; its mirror at resistance, with a long upper wick, is often called a shooting star.
04Context decides#
A pattern only works in context: at a level and in the direction of the larger trend. A pin bar in the middle of a chart, far from any level, is just a candle.
So the order is fixed, and it is not the other way around:
- Trend first on a higher timeframe.
- Then the level: where buyers or sellers have shown up before. See support and resistance.
- Then the candle as confirmation at that level.
- Then the stop and size: the wick of the trigger candle often marks where the idea is wrong, and the position size follows from that distance, as in risk per trade.
05Candles or bars?#
Bar charts show the same four prices with ticks instead of a body. The information is identical; candles are simply easier to read quickly because the body and its color jump out. Use whichever you read faster, and keep the same style across timeframes so you do not have to translate in your head.
Do not drown in patterns. Learn the three above, practice spotting them at levels on old charts, and only then add more.
FAQ#
What do the body and wicks of a candle show?
What does a green or red candle mean?
Which candlestick patterns should a beginner learn first?
Do candlestick patterns work on their own?
Are candles better than a line chart?

DoberInvest on Telegram
Questions about this guide?Ask in the English channel. That is also where we post charts, the levels we watch and what would change our mind. A system, not signals, and no profit promises.
This guide explains how the mechanics work; what you do with them is your own decision. Trading can lose you money, and leverage makes losses bigger and faster. 18+

Founder of DoberInvest, in the market since 2018. Teaches a system, not signals.