
In this guide 8
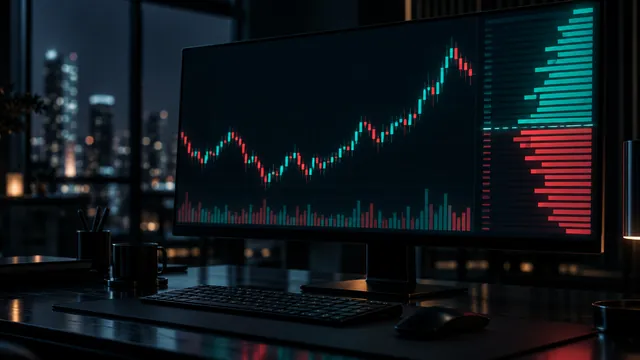
A volume profile shows how much was traded at each price, drawn as a sideways histogram, instead of how much was traded in each period. The longest bar is the point of control (POC), the price both sides accepted as fair. Around it sits the value area, where about 70% of the volume traded. Price tends to move fast through thin zones and slow down or return to heavy ones, because that is where orders are.
01Regular volume answers a different question#
The usual volume bars under the candles show volume by time: how much traded this hour or this day. Useful, but nearly useless for finding levels: it does not show at which prices that volume happened.
A volume profile turns the question by 90 degrees and shows volume by price. The histogram sits on the side of the chart: each horizontal bar is a price, and its length is how much changed hands there.
- A long bar: a lot traded at this price. Buyers and sellers argued and kept finding each other.
- A short bar: price passed through quickly. There was little agreement and few trades.
A candle answers "where did price go". A profile answers "where did the money stay". Those are different questions, and they give different levels.
02Point of control#
The longest bar is the point of control (POC): the price with the highest traded volume. It is not support or resistance in the usual sense. It is a price of agreement, the level both sides considered fair and therefore traded the most.
Its practical value: while price rotates around the POC, the market is in balance, and betting on a breakout of that balance rarely pays. When price leaves the POC far and fast, balance is broken, and that is when real moves happen.
03Value area: where the market considers price normal#
Around the POC sits the value area, the range where about 70% of all the volume traded. Its edges are the value area high (VAH) and value area low (VAL).
Inside the value area the market treats price as normal and is happy to trade. Outside it, price is "expensive" or "cheap" for the market, and it does not stay there long: either it returns, or it reprices the asset and builds a new value area somewhere else.
04Why price returns to where it traded#
A market is an auction. Its job is not to go up but to find prices where trades happen. Two observations follow, and all profile work rests on them:
- Thin zones get crossed fast. Where almost nothing traded, there are few orders to slow the move. Price flies through, in both directions.
- Heavy zones attract. That is where other traders' positions are and where there is someone to trade with. A large player needs volume, and volume sits in the heavy zones.
"Price returns to the POC" is not a law. It is a description of a habit. The habit breaks when new information arrives: an earnings report, a rate decision, an exchange hack. The profile only knows the past.
05Which profile to build#
The same tool gives different answers depending on which slice of history you feed it:
| Profile | What it covers | Good for |
|---|---|---|
| Visible range | Everything on the screen | The big picture: where heavy zones are |
| Session or day | One trading day | Intraday trading and the open |
| One move | From the low to the high of one impulse | Where positions were built in that move, often the pullback target |
On TradingView the visible-range version is a built-in indicator, and drawing a profile over one move is a separate drawing tool.
06Where the profile misleads#
The tool is honest, but it has limits, and knowing them matters more than knowing the levels:
- Too little history, too little meaning. A profile built on two days shows noise, not structure.
- Thin altcoins. On an illiquid coin one large order can draw a "POC" with no real market agreement behind it.
- One exchange's data. Volume differs between exchanges and between spot and futures. A profile from one source describes that source, not the whole market.
- It looks backward. It knows where people traded, not what the next central bank meeting or token unlock will do.
07How to use it tomorrow#
You do not need a new system. Add three steps to what you already do:
- Before entering, put a profile on the latest impulse and find its POC. If your entry is in a thin zone with the POC far behind, expect a pullback toward it.
- Do not put your target inside a heavy zone. Price gets stuck there, and "almost reached it" happens exactly there. Put the target just before the zone.
- Check your horizontal level against the profile. If there is no volume under the line, it is a nice line, not a level. More on levels in support and resistance.
A profile does not predict the future. It shows where the market has unfinished business, and markets return to their own business more often than to anyone's forecast.
FAQ#
What is a volume profile?
What is the point of control (POC)?
What is the value area?
Why does price move fast through low-volume zones?
Which volume profile should I use?

DoberInvest on Telegram
Questions about this guide?Ask in the English channel. That is also where we post charts, the levels we watch and what would change our mind. A system, not signals, and no profit promises.
This guide explains how the mechanics work; what you do with them is your own decision. Trading can lose you money, and leverage makes losses bigger and faster. 18+

Founder of DoberInvest, in the market since 2018. Teaches a system, not signals.