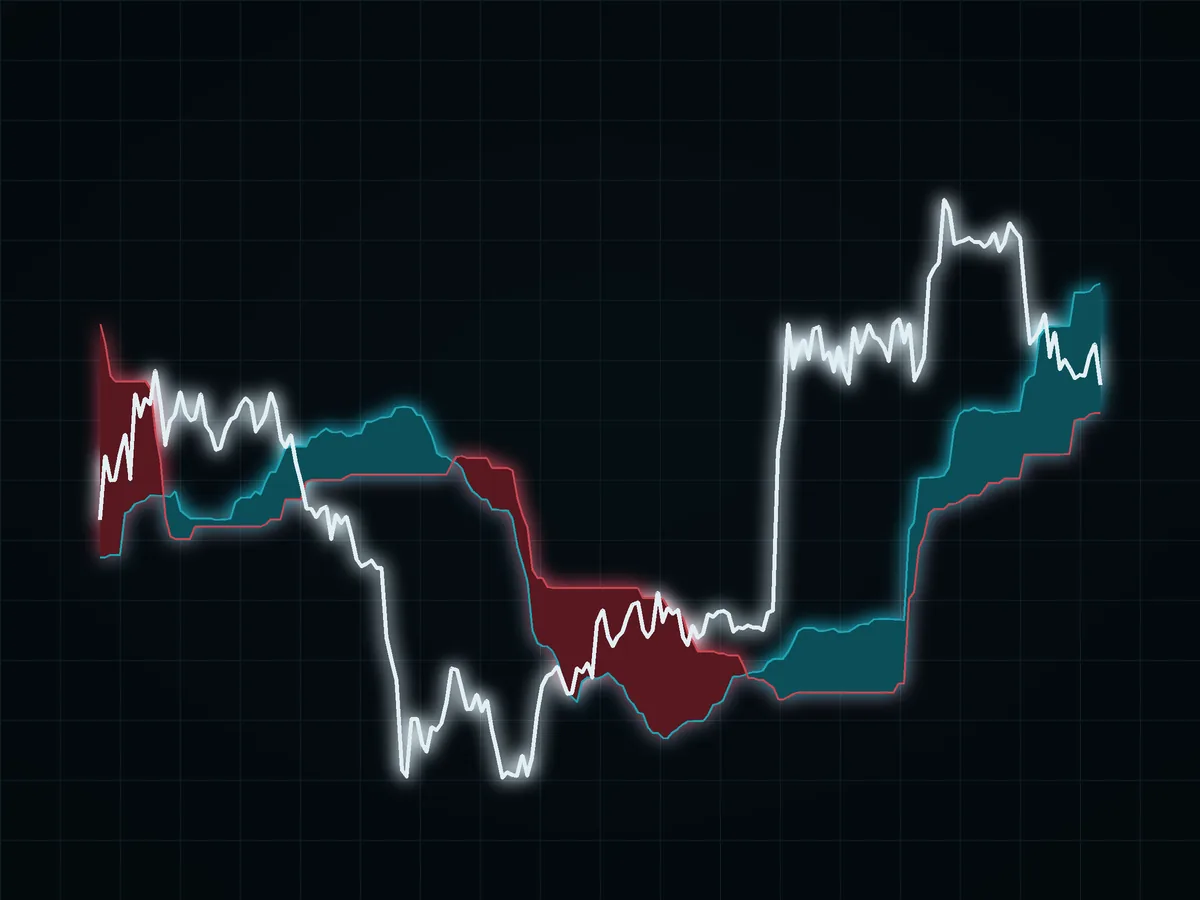

The Ichimoku Cloud (Ichimoku Kinko Hyo) combines conversion, base, leading and lagging lines. Senkou Span A and B are shaded between to form the cloud and are shifted forward. The quickest reading: price above the cloud shows an upward trend state, below it a downward state, inside it no clear state. The other lines add momentum and timing context.
It looks complicated. Underneath, the conversion and base lines are midpoint calculations over different lookback periods. The cloud organizes those ranges; it does not turn shifted historical data into a forecast.
01The five lines#
TradingView's screener documents the common 9, 26 and 52 configuration. The part drawn 26 periods ahead is not a forecast; it is today's calculation shifted forward so you can see where recent ranges sit relative to future candles. The lagging line compares today's close with price 26 periods ago.
| Line | Calculation idea | What it shows |
|---|---|---|
| Tenkan-sen (conversion line) | midpoint of the short lookback's high and low | short-term balance point |
| Kijun-sen (base line) | midpoint of the longer base lookback's high and low | medium-term balance point |
| Senkou Span A | midpoint of Tenkan and Kijun, shifted forward | faster edge of the cloud |
| Senkou Span B | midpoint of a longer range, shifted forward | slower edge of the cloud |
| Chikou Span (lagging line) | current close shifted backward | current price against the past |
How the pieces fit:
- The cloud is the zone between Span A and Span B. Teal or green when A is above B, red when B is above A. A thick cloud marks a wide band of past prices that may act as support or resistance; a thin cloud is easier to cross.
- Tenkan above Kijun means the short-term midpoint is above the medium-term one: momentum is up. Their crossing is the "TK cross".
- The lagging line compares the current close with earlier price action.
Because the cloud is shifted forward by the configured displacement, you can see a cloud plotted ahead of current price. That is not a forecast. It is a calculation from past ranges, moved to the right.
02Worked midpoint model#
Illustrative Ichimoku midpoint model: assume the selected lookback has a highest high of $110 and a lowest low of $90, with a divisor of 2. The range endpoints sum to $200. Dividing that sum by 2 gives a model midpoint of $100.
Midpoint = ($110 + $90) / 2 = $100
This invented calculation shows what a conversion or base line does. The actual line changes with the chosen lookback, feed and chart settings. Price above, below or inside the cloud is context, not a measured probability of the next move.
03How to use it#
- Read the cloud first. One optional ruleset permits long setups above the cloud, short setups below it and no setup inside it. That is a user-defined filter, not evidence of future direction.
- Use the Kijun as an optional trailing reference. A plan may define a close through the Kijun-sen as a review or exit condition, similar to a trailing stop. The rule must be chosen before the trade.
- Look at the cloud ahead. Its width and position describe the shifted ranges used by the indicator; they do not supply a verified probability of reversal.
- Take the stop from structure. The other side of the cloud or the last swing; then size from the stop, as in how to trade crypto futures.
- Do not stack several trend tools. The cloud, a long-term moving average and MACD can repeat the same message. One trend framework is enough.
04Common mistakes#
- Trading every TK cross. A cross without the cloud's context is incomplete.
- Reading the forward cloud as a prediction. It is shifted past data.
- Using Ichimoku on tiny timeframes. Noise and costs can overwhelm the intended trend context.
- Changing settings until history looks perfect. That is curve fitting, not validation.
The Ichimoku Cloud is a trend map that fits on one chart. Use it as one description of trend state, keep any trading rule explicit and let risk management remain separate.
05Primary references#
FAQ#
How do you read the Ichimoku Cloud?
Is the Ichimoku Cloud a leading or lagging indicator?
Does the Ichimoku Cloud work?
What are the best Ichimoku settings for crypto?
What does it mean when price is inside the cloud?

DoberInvest on Telegram
Questions about this guide?Ask in the English channel. That is also where we post charts, the levels we watch and what would change our mind. A system, not signals, and no profit promises.
This guide explains how the mechanics work; what you do with them is your own decision. Trading can lose you money, and leverage makes losses bigger and faster. 18+

Founder of DoberInvest, in the market since 2018. Teaches a system, not signals.