
In this guide 7
Open interest is the total size of futures positions that are still open. Every contract has a buyer and a seller, and open interest counts each contract once. It rises when new positions are opened and falls when positions are closed or liquidated. It tells you how much leverage and commitment sits in the market, not which way the price will go.
On October 23, 2026, open interest on Binance's BTC-USDT perpetual was about $7.81 billion, or 95,912 BTC. That is roughly 0.48% of all bitcoin in circulation, held as open bets on one contract of one exchange.
01Open interest vs volume#
They measure different things:
- Volume counts every trade in a period. A trader who opens and closes ten times in an hour adds ten round trips of volume and zero open interest.
- Open interest is a snapshot of what is still open at a given moment.
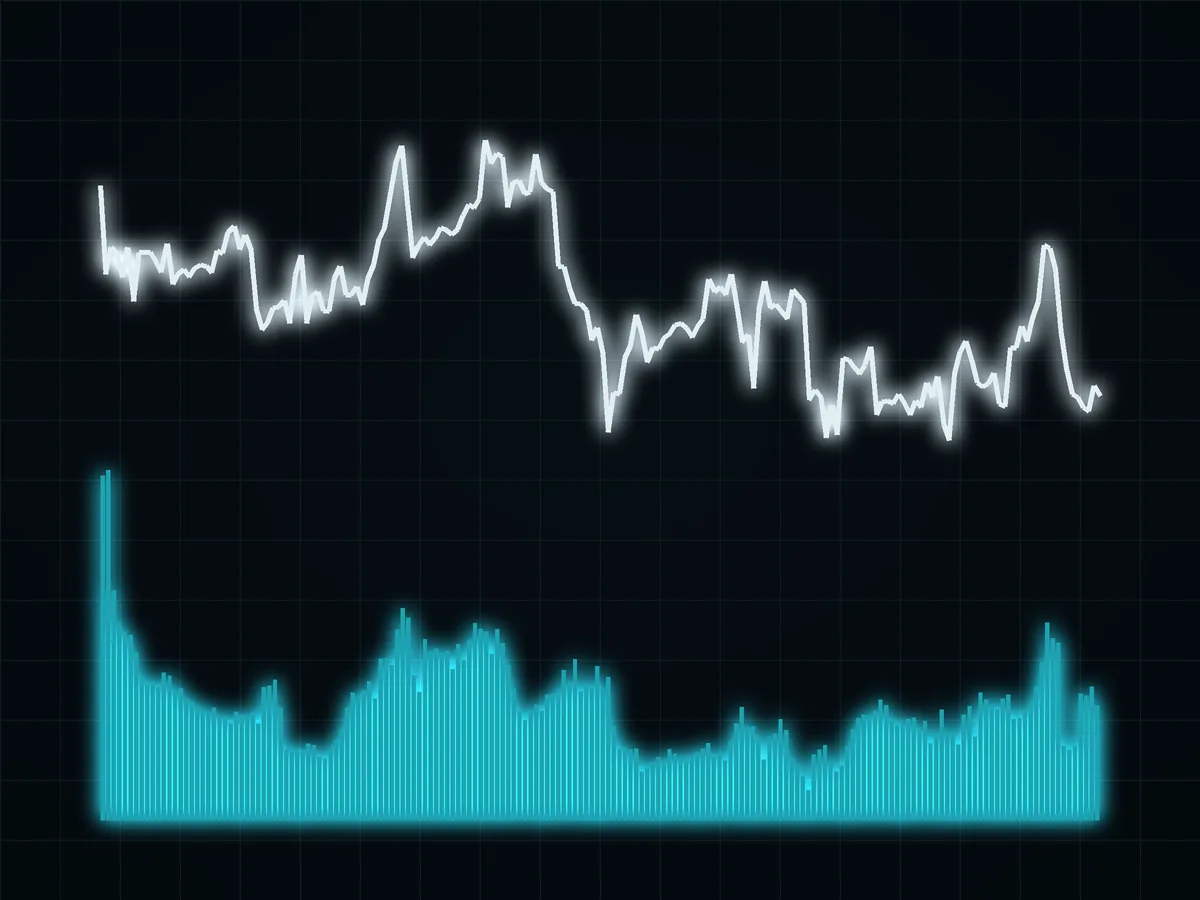
High volume with flat open interest is a market full of in-and-out trading. Rising open interest means positions are being kept, and with them, risk.
02Dollars or coins: the detail that changes the reading#
Most charts show open interest in dollars. That number moves with the price even if nobody opens or closes anything. Over the 30 days to October 23, 2026:
| Coin (Binance USDT-M) | OI now | Change in dollars | Change in coins |
|---|---|---|---|
| BTC | $7.81 billion | -6.1% | -2.6% |
| ETH | $5.57 billion | -9.7% | +1.5% |
| SOL | $0.88 billion | -4.9% | +5.5% |
On a dollar chart, all three look like traders were leaving. In coins, ETH and SOL open interest grew: more contracts were open at the end of the month than at the start. The dollar figure fell because the price fell. If you only look at dollars, you read the opposite of what happened.
For scale on a second venue: on BingX at the same moment, open interest was about $688 million on BTC-USDT, $392 million on ETH-USDT and $201 million on SOL-USDT.
03The four combinations of price and open interest#
The classic reading pairs the direction of price with the direction of open interest:
| Price | Open interest | Usual reading | 4-hour periods on BTC, last 30 days |
|---|---|---|---|
| Up | Up | New longs pushing the price | 37 |
| Up | Down | Shorts closing, a short squeeze or covering | 51 |
| Down | Up | New shorts pushing the price, or longs buying the dip | 51 |
| Down | Down | Longs closing or being liquidated | 39 |
The counts come from 178 four-hour periods of Binance BTC-USDT data. Every box filled up regularly, and the two "opposite" boxes (price and open interest moving in different directions) were the most common, 102 of 178. In a falling month, a lot of the action was dip-buying and short covering, not fresh trend. Open interest on its own did not tell which way the next period would go. Its value is in explaining a move after the fact and in showing when a lot of leverage has built up.
04Sudden drops: leverage leaving at once#
The most useful thing open interest shows is a flush. When a sharp move liquidates a crowd, open interest drops fast. The largest 4-hour drops on BTC over the month:
- -5.4% in the 4 hours to 16:00 UTC on September 23, while the price fell 1.9%: longs being closed out.
- -5.0% in the 4 hours to 04:00 UTC on October 22, with the price down 1.4%.
It works the other way too. On SOL, open interest fell 3.4% in the 4 hours to 16:00 UTC on October 15 while the price jumped 3.8%: shorts being squeezed out.
A 5% fall in open interest within four hours means about $400 million of positions closed in one window. After a flush, fewer leveraged positions are left on that side, so the same cascade has less to feed on. Where the remaining leverage might be forced out is what a liquidation heatmap tries to estimate.
05How to use open interest in practice#
- Check coins, not only dollars. Most data sites let you switch the unit.
- Read it with price. Use the four-box table above to describe what is happening, not to predict.
- Add funding. Rising open interest with rising, positive funding means longs are piling in and paying for it. That is a crowded trade.
- Add the long/short ratio. It shows who holds the new positions by account count; see long/short ratio explained.
- Watch for flushes. A sharp drop in open interest during a fast move is a sign that liquidations just did their work.
06Mistakes with open interest#
- "OI up means bullish." It means more positions on both sides. Every new long has a new short.
- Comparing open interest across coins. $7.8 billion on BTC and $0.9 billion on SOL say nothing about which is more crowded. Compare each coin with its own history or with its market value.
- Ignoring the venue. One exchange's open interest is a slice. Aggregators add venues together, with their own methods.
Open interest, funding and the ratio of longs to shorts together describe how the futures crowd is positioned. How to act on any of it, with size and stops first, is in how to trade crypto futures.
FAQ#
What is open interest in crypto?
What is the difference between open interest and volume?
Is rising open interest bullish?
Why does open interest drop suddenly?
Should I look at open interest in dollars or in coins?

DoberInvest on Telegram
Questions about this guide?Ask in the English channel. That is also where we post charts, the levels we watch and what would change our mind. A system, not signals, and no profit promises.
This guide explains how the mechanics work; what you do with them is your own decision. Trading can lose you money, and leverage makes losses bigger and faster. 18+

Founder of DoberInvest, in the market since 2018. Teaches a system, not signals.