
In this guide 7
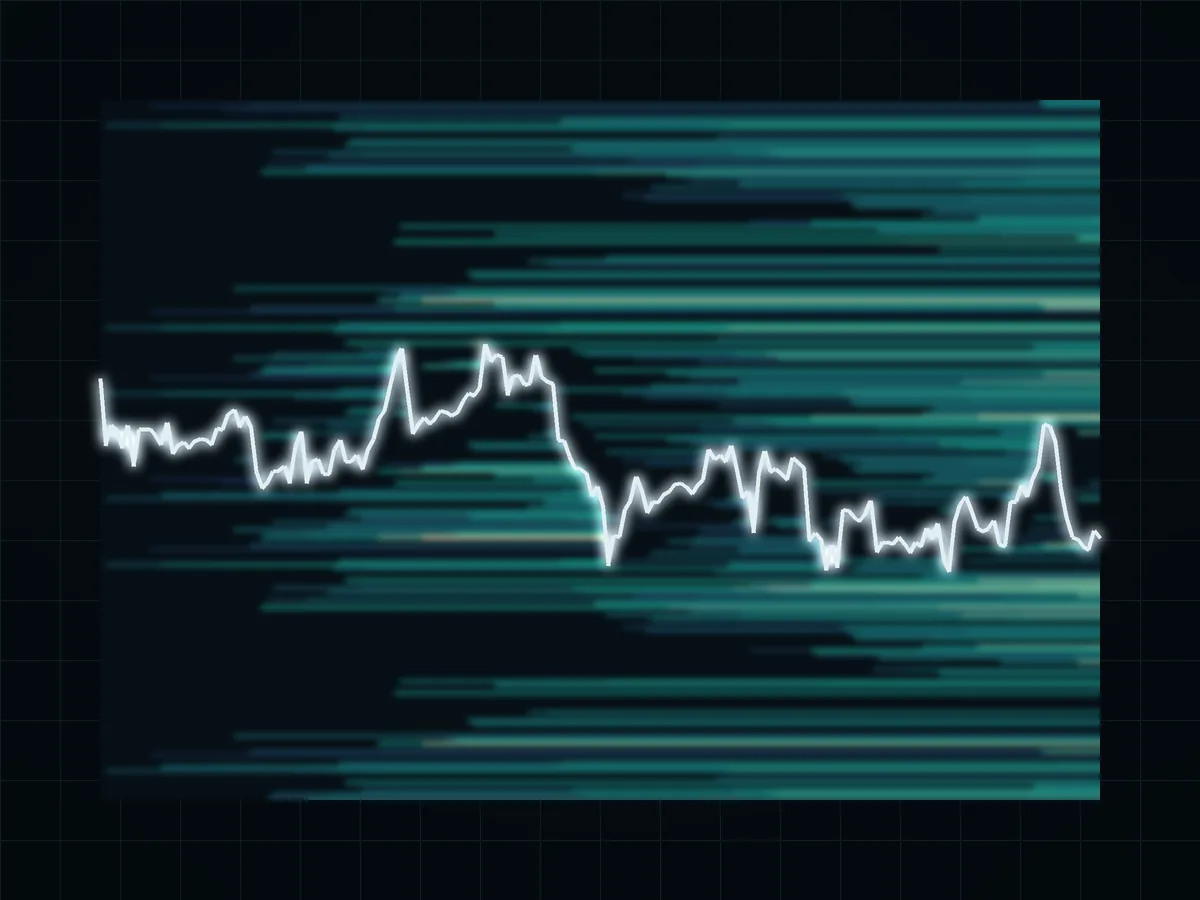
A liquidation heatmap estimates where leveraged futures positions would be force-closed. Price is on the vertical axis, time on the horizontal, and the brighter a band, the more position value the model thinks would be liquidated at that price. Bands above the price are short liquidations, bands below are long liquidations.
The key word is estimates. No exchange publishes every position's liquidation price. The bright bands are a model's guess, built from open interest, price history and an assumed mix of leverage levels. To see how such a guess is made, we built a simple one by hand for BTC from October 2026 prices.
01How a heatmap is built#
The tools do roughly this:
- Take the times and prices where open interest grew: new positions were opened there.
- Assume a spread of leverage among those positions, for example some at 10x, some at 25x, some at 50x and more.
- For each assumed leverage, compute the liquidation price from the entry price.
- Add it all up by price level and color it by size.
Every step contains a guess: which side opened the new positions, at what leverage, and whether they have been closed since. That is why the same coin can look different on CoinGlass, CoinAnk or CoinMarketCap at the same moment.
02A hand-made map for BTC, October 2026#
Liquidation levels for positions opened at three real prices of the 30 days to October 23, 2026, with a 0.5% maintenance margin rate (the rate BingX lists for its perpetuals; real rates grow with position size):
| Opened at | Leverage | Long liquidated near | Short liquidated near |
|---|---|---|---|
| Month high, 87,279 | 10x | 78,945 | 95,529 |
| 25x | 84,208 | 90,318 | |
| 50x | 85,963 | 88,581 | |
| Month low, 79,800 | 10x | 72,181 | 87,343 |
| 25x | 76,993 | 82,579 | |
| 50x | 78,597 | 80,991 | |
| October 23 price, 81,735 | 10x | 73,931 | 89,461 |
| 25x | 78,860 | 84,581 | |
| 50x | 80,503 | 82,955 |
Read it like a heatmap. Longs opened near the month high at 25x and 50x had their liquidation levels at 84,000-86,000. The price later traded down to 79,800, so those bands were crossed and spent. Shorts opened at the month low with 25x sat near 82,600, just above the price on October 23. That is the kind of band a heatmap would draw as bright and still live.
03Which bands the price can actually reach#
A band only matters if an ordinary move can get there. Over the last 365 days the daily BTC range (high minus low) was:
- 2% or more on 274 days. Liquidation levels of 50x positions (about 1.5% away) sit inside a normal day.
- 4.5% or more on 79 days. That is the distance to 20x liquidations: about one day in five.
- 9.5% or more on 4 days. That is roughly where 10x liquidations sit: a rare event.
So the bright bands closest to the price, the ones built from high leverage, are swept almost every day. The bands far away need a large move and a reason.
04How to read a heatmap in practice#
- Compare zones with each other. The absolute numbers depend on the model; the relative brightness is the useful part.
- Check which side is heavier. More bright bands below the price means long leverage is stacked there; more above, short leverage.
- Look for crossed bands. If price already went through a band, those positions are gone. A crossed band does not pull again.
- Confirm with open interest. A real liquidation flush shows up as a sharp drop in open interest. On BTC, open interest on Binance fell 5.4% in the 4 hours to 16:00 UTC on September 23, 2026, while the price fell 1.9%: that is a band being cleared.
- Add the crowd. The long/short ratio and the funding rate show which side is crowded, which tells you which bands are more likely to be well filled.
05What a heatmap cannot tell you#
- It does not tell direction. A bright band above the price is a possible fuel source, not a forecast.
- It cannot see stops. Ordinary stop orders also turn into market orders, and no tool sees them.
- It does not know when positions closed. A band can show positions that were closed by hand days ago.
- It does not include cross margin well. Positions backed by a whole account balance liquidate far from where a single-position formula puts them.
06Using it for your own position#
The most practical use of a heatmap is defensive. If a bright band sits just beyond your stop, your stop is probably in the same place as many others, and a sweep through that band will take it. Moving the stop a little beyond the band, and sizing down to keep the same dollar risk, can keep you out of that sweep. How to place stops is in where to place a stop-loss, how the multiplier moves your own liquidation level is in leverage trading explained, and the formula is in liquidation price explained.
A heatmap shows where other traders' weak points probably are. Make sure your own position is not one of them.
FAQ#
What is a liquidation heatmap?
How do you read a liquidation heatmap?
Are liquidation heatmaps accurate?
Why does price move toward liquidation clusters?
What is the difference between a liquidation map and a liquidation heatmap?

DoberInvest on Telegram
Questions about this guide?Ask in the English channel. That is also where we post charts, the levels we watch and what would change our mind. A system, not signals, and no profit promises.
This guide explains how the mechanics work; what you do with them is your own decision. Trading can lose you money, and leverage makes losses bigger and faster. 18+

Founder of DoberInvest, in the market since 2018. Teaches a system, not signals.