
In this guide 8
Leverage trading in crypto means opening a position larger than the money you put up. With 10x, $100 of margin controls a $1,000 position. Profit and loss are counted on the full $1,000, so a 5% move equals half your margin. The multiplier does not change how much you should risk. It changes how much margin you post and how close liquidation sits.
Most guides stop at "it multiplies gains and losses, start with 2-5x". We counted instead: how many days in the last year each level would have wiped out a position on BTC, ETH and SOL, and what holding it costs as a share of your margin.
01How it works: margin, position, profit and loss#
You post margin, the exchange lets you hold a position several times that size, and every price move is counted on the position.
Take $100 of margin at 10x, so a $1,000 long:
- Price +5%: the position gains $50. That is +50% on your $100.
- Price -5%: the position loses $50. That is -50%.
- Price about -9.5%: what is left of your margin hits the exchange's minimum, and the position is liquidated.
Here is the same arithmetic across levels. Liquidation distances use a 0.5% maintenance margin rate, a round number for illustration; your contract card shows the real rate.
| Leverage | Margin for a $1,000 position | A 5% move, as a share of margin | Liquidation distance, long |
|---|---|---|---|
| 2x | $500 | 10% | 49.8% |
| 5x | $200 | 25% | 19.6% |
| 10x | $100 | 50% | 9.6% |
| 20x | $50 | all of it | 4.5% |
| 50x | $20 | 250% | 1.5% |
At 20x a 5% move is the entire margin, and the position is gone before it gets there. The formula behind the last column is in liquidation price explained.
02How often each level would have been liquidated#
Numbers about "risk" mean little until you put them next to how much the market actually moves. So we took 365 daily candles, October 23, 2025 to October 22, 2026, and asked a simple question: if you opened a long at the daily open (00:00 UTC), on how many days would the low of that same day have reached your liquidation price?
| Leverage | Liquidation distance | BTC, days of 365 | ETH, days of 365 | SOL, days of 365 |
|---|---|---|---|---|
| 2x | 49.8% | 0 | 0 | 0 |
| 5x | 19.6% | 0 | 0 | 0 |
| 10x | 9.6% | 2 | 5 | 7 |
| 20x | 4.5% | 22 | 56 | 61 |
| 25x | 3.5% | 43 | 85 | 102 |
| 50x | 1.5% | 158 | 191 | 223 |
At a ratio of 100 to 1, the distance to liquidation is about 0.5%, and a BTC long opened at the open would have been wiped out the same day on 275 days out of 365.
Shorts look almost the same: at 20x a short opened at the open would have been liquidated on 22 BTC days, 47 ETH days and 59 SOL days.
Two numbers explain the table. The median BTC day in that year moved 2.97% from high to low; for SOL it was 4.51%. And the median drop from the open to the day's low was 1.22% on BTC and 2.08% on SOL. A 20x position has 4.5% of room. That is roughly two ordinary SOL days stacked together.
03What it costs: fees and funding on the full position#
Trading fees and funding are both charged on the position, not on your margin. Higher leverage means the same costs take a bigger bite out of the money you actually put in.
Fees. At a 0.05% taker fee, opening and closing a position costs 0.1% of its value. At 10x that is 1% of your margin per round trip. At 50x it is 5%, before the price has moved at all. Maker orders cut this; see maker vs taker fees.
Funding. On the BingX BTC-USDT perpetual, the average funding rate over 1,000 settlements (November 24, 2025 to October 23, 2026) was 0.0039% per 8 hours, paid by longs most of the time. As a share of margin, holding a long at that average costs:
| Leverage | Per day | Per 30 days |
|---|---|---|
| 1x | 0.01% | 0.35% |
| 5x | 0.06% | 1.73% |
| 10x | 0.12% | 3.47% |
| 20x | 0.23% | 6.93% |
| 50x | 0.58% | 17.33% |
At 50x, a month of average funding costs about a sixth of the margin while the chart can stay flat. And funding comes out of the same margin that keeps the position alive, so liquidation drifts closer as you hold. How the rate works is in funding rate explained.
04How much leverage is safe?#
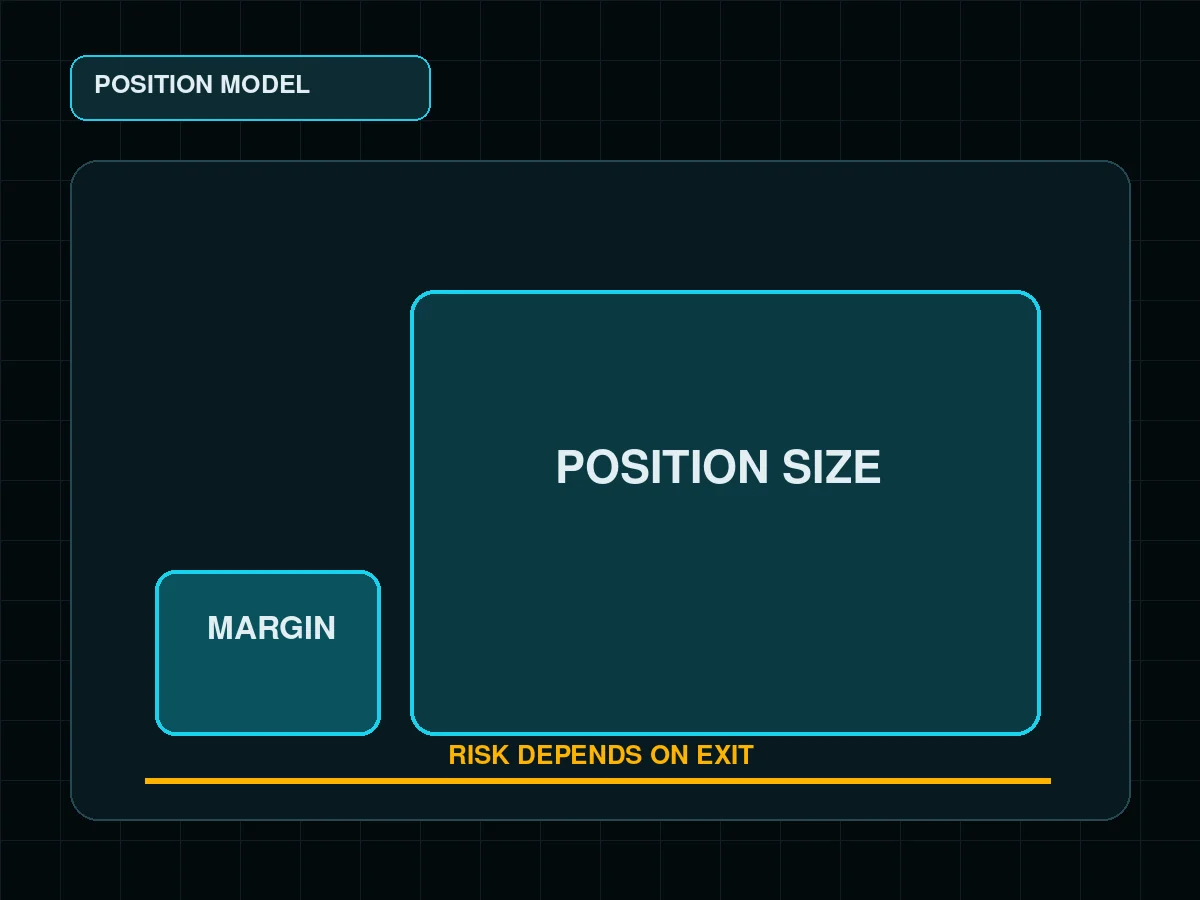
None is safe by itself, and none is dangerous by itself. The question is upside down. Risk is set by position size and stop distance, and the multiplier comes out of that calculation at the end.
Example: a $10,000 account, 1% risk ($100), a stop 4% below entry. The position is $100 ÷ 4% = $2,500, whatever multiplier you pick. What the multiplier changes:
| Leverage | Margin posted | Liquidation distance | Stop at 4% works? |
|---|---|---|---|
| 2x | $1,250 | 49.8% | yes |
| 5x | $500 | 19.6% | yes |
| 10x | $250 | 9.6% | yes |
| 20x | $125 | 4.5% | barely |
| 25x | $100 | 3.5% | no, liquidation comes first |
Above about 22x, the exchange closes you before your stop is reached, and the planned $100 loss turns into a forced close at a worse price. The working rule from this: liquidation should sit several stop distances away, not just beyond the stop. At 5x it is about five stop distances away here; at 20x it is barely one.
The full sizing method, with losing-streak tables, is in risk per trade, and how to find a stop that means something is in where to place a stop-loss.
05Where leverage comes from in crypto#
- Perpetual futures. The most common route. No borrowing: you hold a contract and post margin, and pay or receive funding. See perpetual futures explained.
- Dated futures. Same margin logic, with an expiry instead of funding.
- Spot margin. You borrow real coins or dollars and pay interest on the loan. The coins you buy are real, and so is the debt.
All three let you go short as well as long. The step-by-step flow for futures is in how to trade crypto futures.
06Isolated or cross: how much you can lose#
With isolated margin, the loss on a position is normally capped at the margin you posted for it. With cross margin, the whole futures balance backs every open position: liquidation is further away, and the possible loss is the entire balance. Cross margin hides the risk instead of removing it. Details in isolated vs cross margin.
07The habits that turn leverage into a blown account#
- Picking 20x first and the size second. The position grows to fill the margin, and the 1% plan becomes 10%.
- Adding margin to a losing trade. It pushes liquidation away and raises what you can lose on an idea that is already wrong.
- Holding high leverage for weeks. Funding on the full position eats the buffer.
- No stop because "liquidation is my stop". Liquidation is the most expensive exit: a forced market order at the worst moment.
Leverage is a way to tie up less capital per position. Used that way, with size from risk and a real stop, a moderate level is a tool. Used to make a small account feel bigger, it is the fastest way to empty it.
FAQ#
What does 10x mean in crypto trading?
How much leverage is safe in crypto?
Can you lose more than you invest with leverage?
What happens when a leveraged trade goes against you?
Is margin trading the same as futures trading?

DoberInvest on Telegram
Questions about this guide?Ask in the English channel. That is also where we post charts, the levels we watch and what would change our mind. A system, not signals, and no profit promises.
This guide explains how the mechanics work; what you do with them is your own decision. Trading can lose you money, and leverage makes losses bigger and faster. 18+

Founder of DoberInvest, in the market since 2018. Teaches a system, not signals.