
In this guide 6
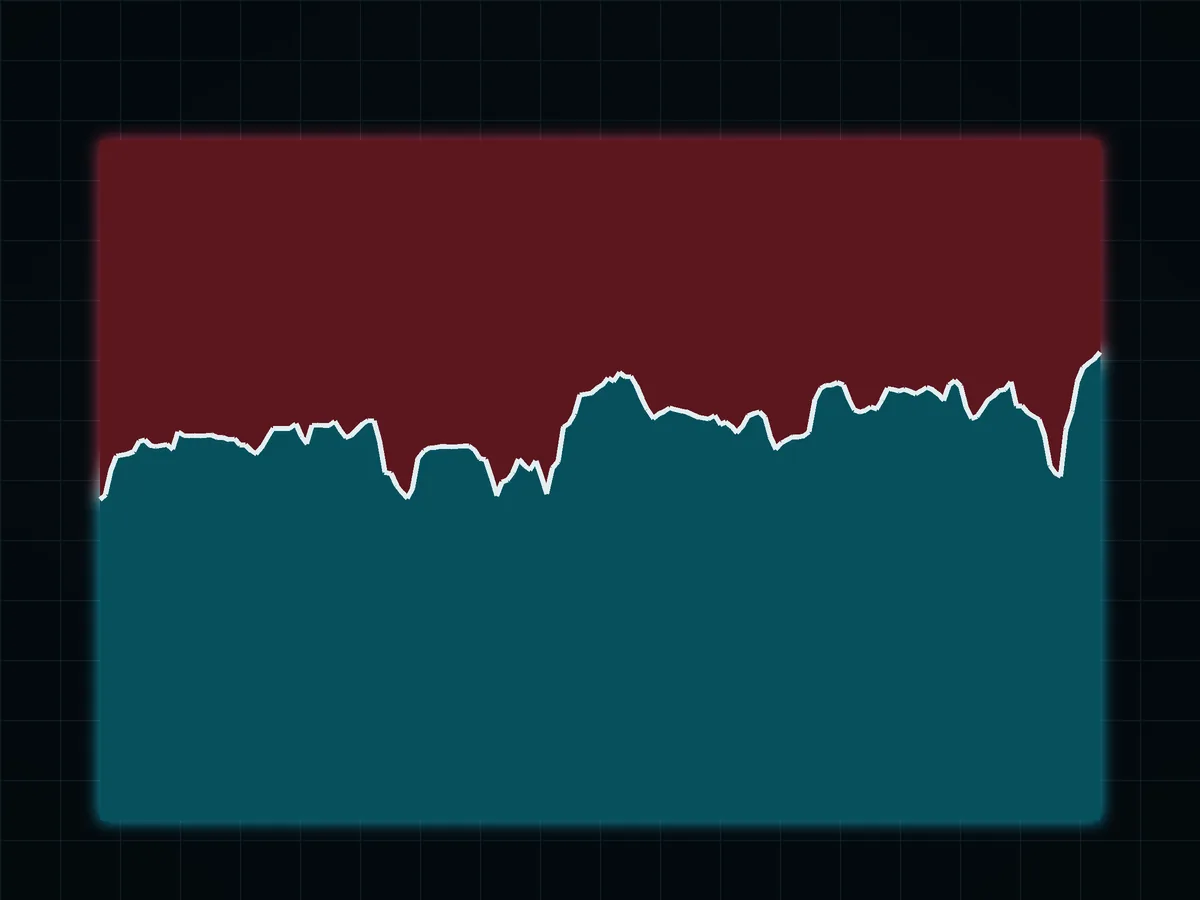
The long/short ratio compares how many accounts on an exchange hold long futures positions with how many hold shorts. A ratio of 2 means two long accounts for every short account. It shows how the crowd is positioned. It does not show where the price is going, and it does not count money.
That last point confuses most readers. In futures, every long has a short on the other side, so in contracts longs and shorts are always equal. On October 23, 2026 the BTC ratio on Binance still read 2.10. Here is what that number is made of, and what a month of data says about using it.
01What the ratio counts#
Exchanges usually publish three different numbers under similar names:
| Version | What it counts | BTC on Binance, October 23, 2026 |
|---|---|---|
| Accounts ratio | Accounts net long ÷ accounts net short, all users | 2.10 (67.8% of accounts long) |
| Top traders, by positions | Long position size ÷ short position size among the largest accounts | 1.48 |
| Taker buy/sell ratio | Volume of market buys ÷ market sells over the period | between 0.91 and 1.12 over the last 30 days |
The accounts ratio is the one most charts show. Because longs and shorts are always equal in contracts, a reading of 2.10 has one meaning: the long side is spread across many accounts, and the short side sits with fewer, bigger accounts. Put simply, a lot of small traders were long, and a smaller group with more money per account was short.
The top-trader ratio weighs by size, so it sits much closer to 1. When the two diverge, the crowd and the large accounts disagree.
02What a month of real data showed#
We pulled daily and 4-hour readings from Binance USDT-margined futures for September 24 to October 23, 2026.
| Coin | Accounts ratio, 30-day low | 30-day high | Latest | Top traders by position, latest |
|---|---|---|---|---|
| BTC | 1.02 | 2.10 | 2.10 | 1.48 |
| ETH | 2.35 | 3.55 | 3.55 | 1.65 |
| SOL | 1.46 | 2.92 | 2.92 | 2.26 |
Two things stand out.
The crowd bought the dip, fast. At 00:00 UTC on October 22 the BTC ratio was 1.02, almost even, with BTC near 84,050. Twenty-four hours later it was 2.10, with BTC near 81,400. In one day of a roughly 3% drop, the accounts went from evenly split to two longs for every short. ETH did the same over the same day: from 2.35 to 3.55, while the price slipped from about 2,474 to 2,389.
Big accounts went the other way. Over the same month the BTC top-trader position ratio fell from 1.89 to 1.48. Large accounts cut their long exposure while small accounts added.
We then checked 4-hour periods, 178 per coin. Within the same 4 hours, the ratio and the price moved in opposite directions most of the time: in 109 of 175 periods on BTC and 118 of 175 on ETH. The correlation was clearly negative: -0.53 on BTC, -0.58 on ETH, -0.42 on SOL. The crowd reacts to the price: it goes long into drops and takes profit into rises.
Then the sobering part. Does a change in the ratio say anything about the next 4 hours? The correlation was -0.03 on BTC, 0.06 on ETH and 0.05 on SOL, which is effectively zero. The ratio describes what the crowd just did. It did not tell what the price would do next.
03How to read it without fooling yourself#
- Compare with the coin's own range. ETH sat between 2.35 and 3.55 all month; BTC between 1.02 and 2.10. A BTC reading of 2.5 would mean something; an ETH reading of 2.5 would not.
- Look at the split between crowd and top traders. Crowd long and large accounts trimming is a different picture from both sides long.
- Add funding. The ratio counts heads; the funding rate shows how much the crowded side pays to stay there. A high ratio with modest funding is weaker evidence than a high ratio with hot funding.
- Add open interest. A ratio rising while open interest also rises means new positions are being opened by the crowd. A ratio rising while open interest falls means shorts are closing, which is a different story.
- Never use it as the reason for a trade. It is context. A one-sided crowd is fuel for a squeeze, but the squeeze needs a trigger and can come weeks later, or not at all.
04Why a crowded long side matters#
When many small accounts hold longs with leverage, their stops and liquidation levels sit below the price. If the price drops into them, forced selling pushes it lower and sets off the next layer. That is a long squeeze, the mirror image of the short squeeze described in how to short crypto. Where those levels cluster is what a liquidation heatmap tries to estimate; how leverage places them is in liquidation price explained.
05Common mistakes#
- Reading 2.0 as "twice as much money is long". It is accounts, not money.
- Comparing ratios across coins or exchanges. Each has its own normal level.
- Shorting because the crowd is long. The crowd can be right for a long time, and a short against it still needs a stop. See leverage trading explained before sizing one.
- Watching it hourly for clues. In our data the 4-hour changes told nothing about the next 4 hours. The useful information is the trend over days and the gap between crowd and large accounts.
The ratio is one dial on the futures dashboard. The full picture, from contract choice to exit, is in how to trade crypto futures.
FAQ#
What does the long/short ratio mean in crypto?
How can there be more longs than shorts?
What is a good long/short ratio?
How do you calculate the long/short ratio?
Is a high long/short ratio bearish?

DoberInvest on Telegram
Questions about this guide?Ask in the English channel. That is also where we post charts, the levels we watch and what would change our mind. A system, not signals, and no profit promises.
This guide explains how the mechanics work; what you do with them is your own decision. Trading can lose you money, and leverage makes losses bigger and faster. 18+

Founder of DoberInvest, in the market since 2018. Teaches a system, not signals.