In this guide 9
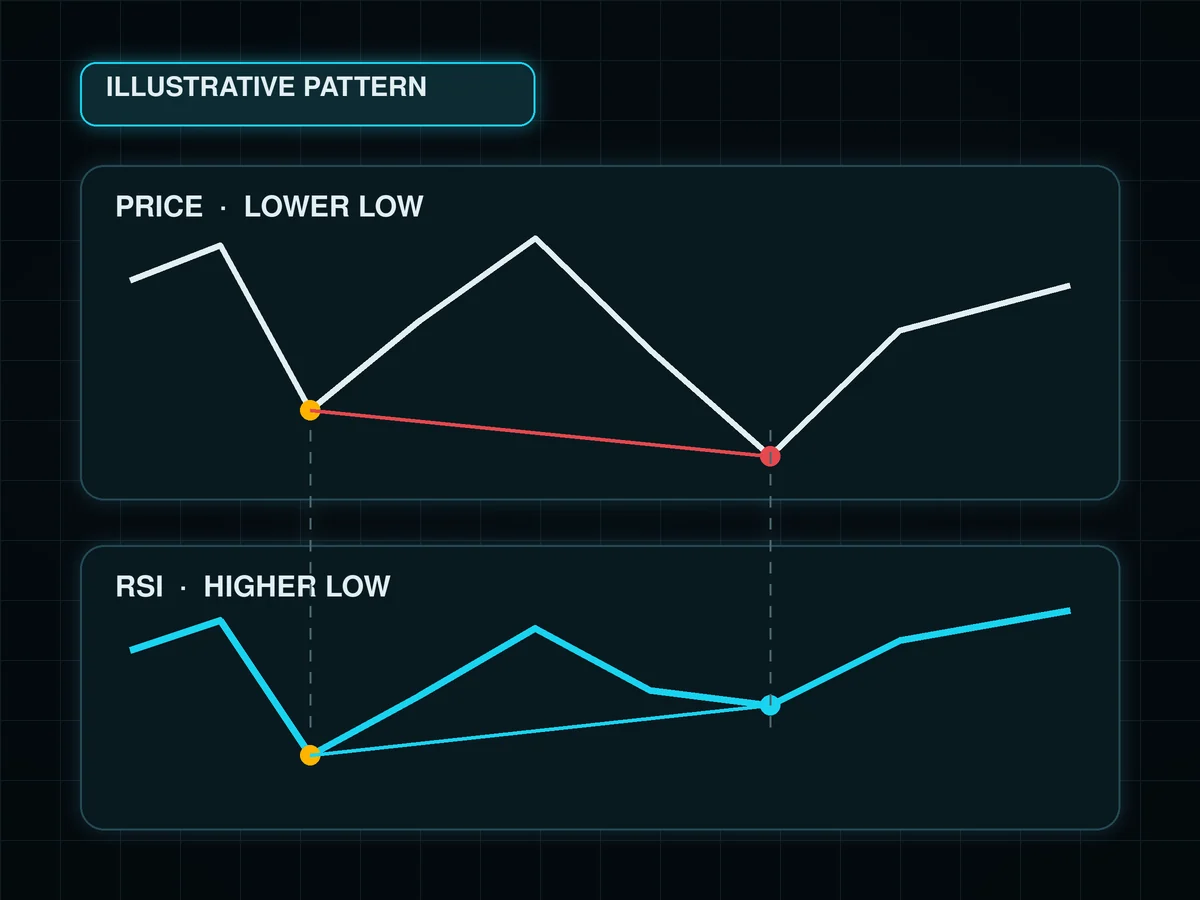
RSI divergence happens when price makes a new extreme but momentum does not confirm it. A lower low in price with a higher low in the Relative Strength Index is bullish divergence. A higher high in price with a lower RSI high is bearish divergence.
That definition is simple. Trading it is not. Divergence can remain visible while price keeps trending, two traders can choose different swing points, and an unfinished candle can erase the pattern before it closes. The useful question is not "is there divergence?" It is: what must price do next to confirm the idea, and where is the idea wrong?
This guide uses the standard 14-bar RSI, completed candles and a worked example with illustrative prices. The example is not a backtest or a claim about future performance.
01The two regular RSI divergence patterns#
| Pattern | Price | RSI | What it may mean |
|---|---|---|---|
| Regular bullish | lower low | higher low | selling momentum weakened |
| Regular bearish | higher high | lower high | buying momentum weakened |
TradingView defines regular bullish and bearish divergence in the same way and describes RSI as a momentum oscillator based on closing-price gains and losses. Its documentation also gives the formula: RSI = 100 - 100 / (1 + RS), where RS compares average gains with average losses over the selected period.
If RSI itself is unfamiliar, begin with RSI indicator explained before using the pattern.
02A clean way to mark the swings#
Most bad divergence screenshots start with two arbitrary dots. Use a repeatable process instead:
- Choose one market and one timeframe.
- Wait for two completed swing lows or two completed swing highs.
- Place each RSI point under the exact candle that made the price swing.
- Compare closes with closes, or wicks with wicks, but do not switch halfway.
- Keep RSI length and price source unchanged.
The second price point must actually exceed the first for regular divergence. Two equal lows can form a useful support test, but they are not the clean lower-low structure the definition requires.
The points should also be separated by a visible reaction. If price prints five nearly identical candles in a tight range, selecting the first and fifth only because the oscillator moved is curve fitting, not a clear market structure.
03Confirmation comes from price#
Divergence measures momentum. Your order is filled in price. That is why a divergence line alone is not an entry.
For a bullish setup, mark the reaction high between the two lows. Confirmation can be a candle close above that high, followed by a hold or retest. For a bearish setup, use the reaction low between the two highs. A close through it shows that price structure changed in the direction suggested by the momentum warning.
This delays the entry. That is a feature, not a flaw. Buying the second low gives a better headline price but no evidence that sellers stopped controlling the market. Waiting for structure gives up part of the move in exchange for information.
Use support and resistance to mark the reaction level consistently. If the confirmation candle is so large that the stop becomes impractical, skip the trade instead of forcing the size.
04Worked bullish example#
Assume a liquid market prints this sequence on completed four-hour candles:
- First swing low: price 100, RSI 27.
- Reaction high: price 102.
- Second swing low: price 96, RSI 33.
- Confirmation: a candle closes above 102 at 102.50.
Price made a lower low from 100 to 96. RSI made a higher low from 27 to 33. That is regular bullish divergence. The close above 102 is the price confirmation.
Now define the trade before deciding whether to take it:
| Item | Illustrative value |
|---|---|
| Entry after confirmation | 102.50 |
| Invalidation below second low | 95.50 |
| Risk per unit | 7.00 |
| First objective | 116.50 |
| Reward per unit | 14.00 |
| Reward versus risk | 2 times |
For a $10,000 account risking 0.5% (a 0.005 fraction), the maximum planned loss is $50. Position size is $50 divided by $7, or 7.14 units before fees and slippage. If the market only trades whole units, round down.
The calculation does not make the setup profitable. It limits the damage if the interpretation is wrong. Our risk per trade guide explains why size comes after the stop, not before it.
05When the setup is invalid#
A bullish divergence idea is invalid when price breaks the second swing low after the planned entry. A bearish idea is invalid when price breaks the second swing high. Put the stop where the market disproves the structure, then size the position to that distance.
Cancel the setup before entry when:
- the confirmation never arrives;
- a new price extreme changes the two swing points;
- RSI is recalculated on a different timeframe or setting;
- the required stop is larger than the account's risk limit;
- the next meaningful level leaves too little room for the target.
Do not move the swing point after a loss to make the old drawing look correct. That destroys the audit trail.
06Why divergence fails#
A strong trend can stay strong. Price can make several higher highs while RSI makes lower highs. Momentum slowed, but buyers still controlled structure.
The newest bar is unfinished. RSI uses closing prices. An intrabar divergence can disappear at the close.
The swings were chosen after the outcome. Once the reversal is visible, it is easy to find two points that predicted it. Mark setups in real time or save timestamped screenshots.
Costs erase a small edge. A tight target can look attractive before spread, fees and slippage. Record the actual fill, not the line drawn on the chart.
Divergence is not present at every reversal. TradingView's divergence guide explicitly warns that the pattern should be combined with other analysis and does not appear before every turning point.
07A checklist before the order#
- Two completed, comparable price swings exist.
- RSI points match the exact swing candles.
- RSI settings and timeframe did not change.
- The pattern is labelled bullish or bearish before confirmation.
- Price confirmation is written in advance.
- Invalidation is beyond the relevant swing.
- Position size is calculated from a fixed account risk.
- Fees and slippage are included in the journal.
- The next level leaves enough room for the planned target.
RSI divergence is best treated as a momentum warning that earns attention, not permission to trade. Let price confirm, let the swing define invalidation, and let account risk define size.
08Sources checked#
- TradingView: Relative Strength Index, formula, standard settings and regular divergence definitions, checked October 30, 2026.
- TradingView: RSI divergence indicator, confirmation limitations and warning against using divergence alone, checked October 30, 2026.
FAQ#
What is bullish RSI divergence?
What is bearish RSI divergence?
Which RSI settings should I use for divergence?
Does RSI divergence always work?
How do I confirm RSI divergence?

DoberInvest on Telegram
Questions about this guide?Ask in the English channel. That is also where we post charts, the levels we watch and what would change our mind. A system, not signals, and no profit promises.
This guide explains how the mechanics work; what you do with them is your own decision. Trading can lose you money, and leverage makes losses bigger and faster. 18+

AI-assisted editorial draft prepared and fact-checked against the cited sources; published by the DoberInvest editorial team, not as Konstantin Shulga's personal experience.