

In this guide 7
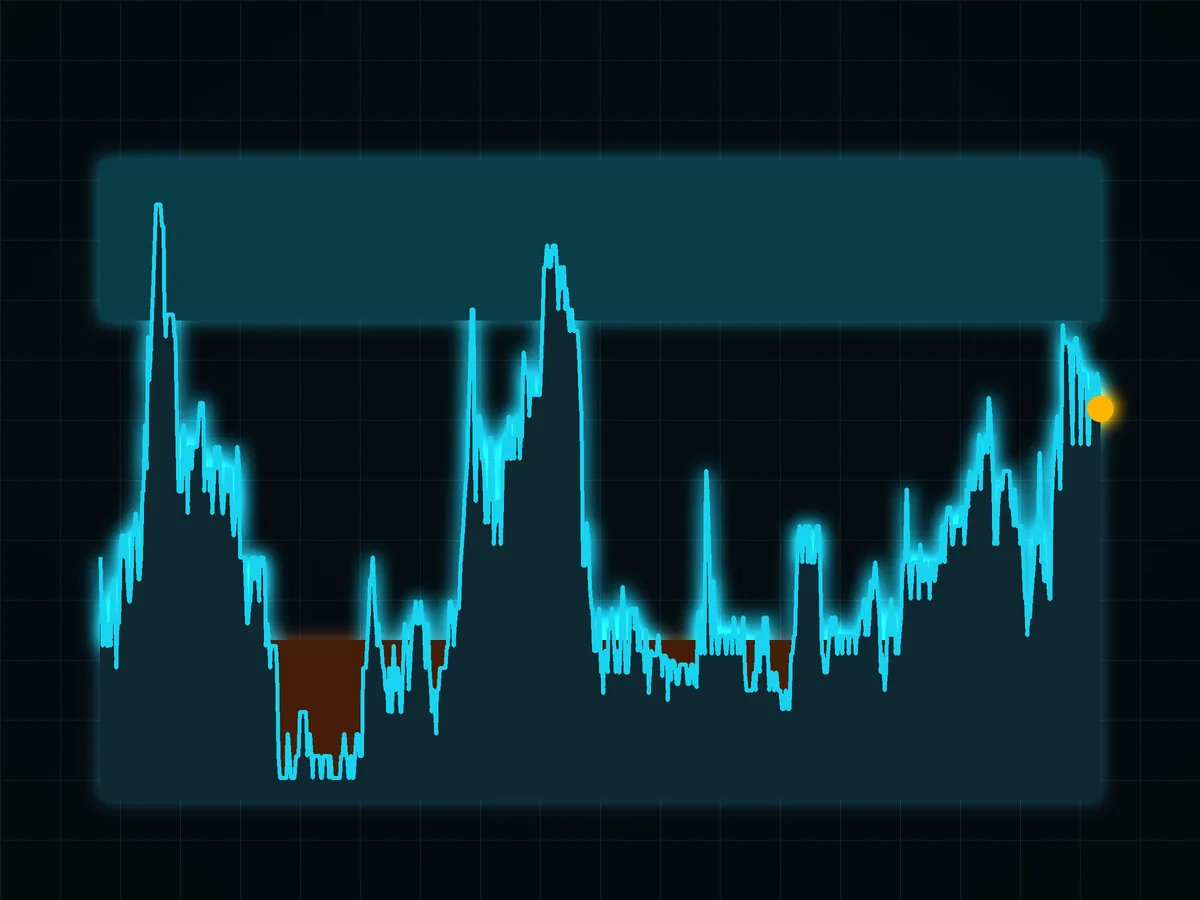
Everyone has heard of Bitcoin dominance. USDT dominance (USDT.D) is the less famous chart that often tells you more about mood: it shows how much of the crypto market is sitting in Tether instead of coins. When it climbs, money is hiding in cash. When it falls, cash is going back into Bitcoin and altcoins.
01What USDT dominance measures#
USDT dominance is Tether's market cap divided by the market cap of the whole crypto market, shown as a percentage. In late October 2026 Tether was worth about $182 billion out of roughly $2.74 trillion, so USDT.D sat near 6.7%.
Why it matters: on most exchanges USDT is the cash of crypto. When someone sells Bitcoin, the money rarely leaves for a bank account. It usually lands in USDT and waits. So the USDT share is a rough measure of how much money is on the sidelines, ready to come back or ready to stay out.
On TradingView you can pull it up with the ticker USDT.D. Different data providers count the total market a little differently, so the exact number varies by a few hundredths of a percent. The direction is what you read.
02How to read it: a mirror of the market#
The main rule: USDT.D usually moves against the market.
- USDT.D rises: money moves from coins into cash. Fear, risk-off, selling. The market is usually falling at the same time.
- USDT.D falls: cash goes back into Bitcoin and altcoins. Appetite for risk is back. The market is usually rising.
Bitcoin goes up, USDT.D goes down. The market panics, USDT.D spikes. It is the same story told from two sides.
03Levels on USDT.D work in reverse#
The same chart reading you use on coins works here: support, resistance, trend lines. You just read the result upside down.
| What USDT.D does | What it usually means for the market |
|---|---|
| Hits resistance and turns down | Cash is ready to leave the sidelines, often near a local market bottom |
| Breaks support to the downside | Cash is flowing into risk, fuel for a rally |
| Bounces up from support | Money runs back to cash, time for caution |
| Grinds higher in a channel | Slow risk-off, rallies tend to fade |
04The math trap: dominance can rise with no new buyers of USDT#
This is the part most posts skip. Dominance is a ratio, so it moves when either side of the fraction moves.
Take the late October 2026 picture: USDT about $182 billion, total market about $2.74 trillion, USDT.D about 6.65%.
- Coins drop 10%, USDT supply unchanged. Everything except USDT loses a tenth of its value, the total falls to about $2.48 trillion, and USDT.D jumps to about 7.34%. Nobody bought a single extra USDT. The chart still looks like a rush to safety.
- Coins rise 10%, USDT unchanged. USDT.D slips to about 6.08% without a single USDT being spent.
- Tether mints $5 billion, market flat. USDT.D ticks up to about 6.82%. New cash arrived, and dominance went up, even though that cash is future buying power.
- Tether mints $5 billion and coins rise 5%. USDT.D ends near 6.52%, lower than before, despite the new supply.
So a rising USDT.D does not prove people are selling into stablecoins. Often it just means coins got cheaper. Check the price chart next to it before you read a story into the line.
05USDT.D, USDC.D and BTC.D together#
USDT is the biggest stablecoin, but not the only one. USDC held about 2.6% of the market in late October 2026, so the two together were close to 9.3%. Some traders watch USDT.D + USDC.D as one "cash" line, which smooths out moves where money simply switches from one stablecoin to the other.
The pairing with Bitcoin dominance is simple and useful:
- BTC.D answers "Bitcoin or altcoins?"
- USDT.D answers "risk or cash?"
Two charts, five seconds, and you have a map of market mood before you open a trade. Bitcoin dominance has its own guide: Bitcoin dominance explained.
06How to use it before a trade#
USDT.D does not say buy or sell. It says where the money is right now. A practical checklist:
- Open USDT.D on the same timeframe as your trade. A 4-hour setup needs the 4-hour dominance chart, not the weekly.
- Mark the nearest support and resistance on it. Price levels on USDT.D are as readable as on Bitcoin.
- Going long while USDT.D pushes into resistance? Fine, but wait for the rejection. Buying while dominance is still breaking out means trading against the flow of money.
- Check the cause. Is dominance rising because coins are falling or because supply jumped? The price chart answers that in a glance.
- Size the position as if you are wrong. No chart, this one included, removes the need for a stop. If you are unsure how much to risk, read risk per trade.
The short version: before you enter, glance at USDT.D. Climbing toward resistance? No rush to go long. Turning down? Money is coming back into the game.
FAQ#
What is USDT dominance?
Is rising USDT dominance bearish?
What is the difference between USDT dominance and USDT supply?
Should I add USDC dominance to USDT dominance?

DoberInvest on Telegram
Questions about this guide?Ask in the English channel. That is also where we post charts, the levels we watch and what would change our mind. A system, not signals, and no profit promises.
This guide explains how the mechanics work; what you do with them is your own decision. Trading can lose you money, and leverage makes losses bigger and faster. 18+

Founder of DoberInvest, in the market since 2018. Teaches a system, not signals.