
In this guide 7
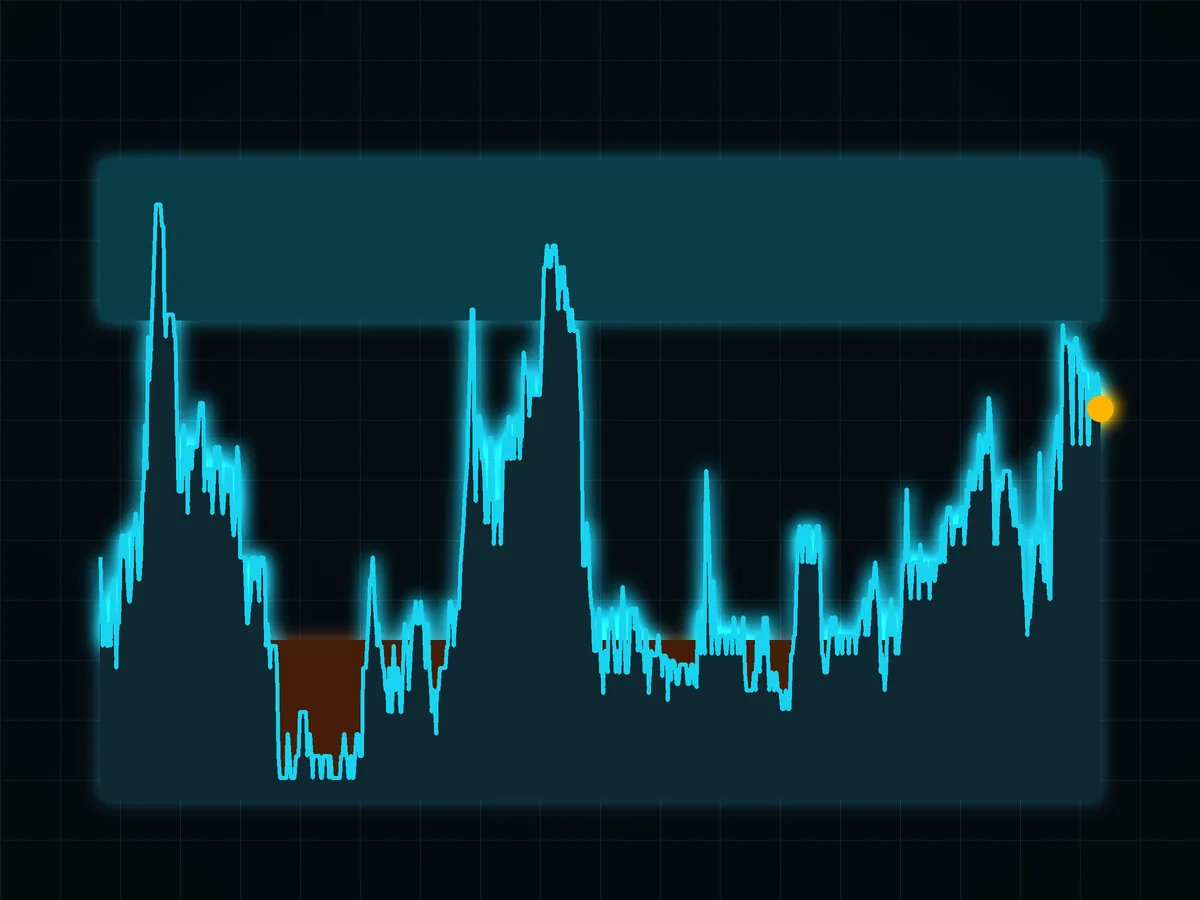
An altcoin season index is a breadth measure: it counts how many members of a defined altcoin basket outperformed Bitcoin during a selected lookback window. The arithmetic is easy. The basket, exclusions, timestamps and price source decide what the number means.
It is a description of the completed window, not a forecast. Before reading the gauge, read the methodology.
01How the index is calculated#
- Define the basket. State the ranking date and whether the list is rebuilt through history.
- Remove what is not an "altcoin bet": stablecoins, tokenized gold and funds, wrapped and staked versions of other coins. Sites differ on exchange tokens.
- Measure each coin's price change over the same exact window and Bitcoin's change over those timestamps.
- Count the coins that did better than Bitcoin and divide by the number of coins.
02Worked breadth model#
Illustrative altcoin-season model: assume a basket of 10 eligible altcoins and a completed window in which 7 beat Bitcoin. In this illustrative model, the score is the outperformer count divided by the eligible count, multiplied by 100.
Score = 7 / 10, converted to a percentage = 70
The model score is 70. It is invented arithmetic, not a current market reading. If the basket drops a coin with missing history, the denominator changes and the score must be recalculated rather than silently treating the missing return as a loss.
03What the number hides#
Working through the definition makes the blind spots visible.
- The window changes the answer. Short and long lookbacks can describe different leadership regimes on the same day.
- The coin list changes the answer. Using today's leaders for old dates introduces survivorship bias. Rebuilding the basket through history avoids that specific error but produces a different series.
- The source changes the answer. A provider using one venue can omit coins not listed there, while an aggregator can use a wider set. The methodology must say which approach it uses.
- It counts winners, not size. A narrow win and a large win count the same; the score does not show the magnitude or the losses of the remaining coins.
- It looks backwards. A high value means leadership already occurred inside the selected window.
So two sites can show different values on the same day and both follow their published rules. Ask which coins, which window and which prices.
04How to use it#
- As context, not a trigger. A low reading says Bitcoin has led; a high one says altcoins have. Neither says what happens next.
- Pair it with dominance. The index counts coins, Bitcoin dominance weighs them by size, and USDT dominance shows money parked on the sidelines. When they disagree, look at the coins themselves.
- Check your own coins. Breadth across a basket does not describe the return or liquidity of the asset you hold.
- Size altcoin trades from the actual stop. The sizing steps are in position size calculator, and the order of sizing and leverage on futures is in how to trade crypto futures.
- Watch sentiment alongside it. Compare breadth with fear and greed without treating either as an entry trigger.
05Common mistakes#
- Buying altcoins because a provider changed the label. The move it measures has already happened.
- Comparing numbers from different sites. Methods differ; compare one source with itself.
- Forgetting the survivors. Today's leaders are a list of assets that remained large enough to qualify.
- Treating "altcoin season" as all altcoins. A median coin and your coin are different things.
The altcoin season index is a one-line summary of breadth within a provider's chosen basket and window. Read the methodology before the gauge, use it as a past-tense scoreboard and check the coins you actually hold.
06Methodology reference#
FAQ#
What is the altcoin season index?
What is the altcoin season index today?
How long does altcoin season last?
How do you read the altcoin season index?
Why do altcoin season index values differ between sites?

DoberInvest on Telegram
Questions about this guide?Ask in the English channel. That is also where we post charts, the levels we watch and what would change our mind. A system, not signals, and no profit promises.
This guide explains how the mechanics work; what you do with them is your own decision. Trading can lose you money, and leverage makes losses bigger and faster. 18+

Founder of DoberInvest, in the market since 2018. Teaches a system, not signals.