

In this guide 6
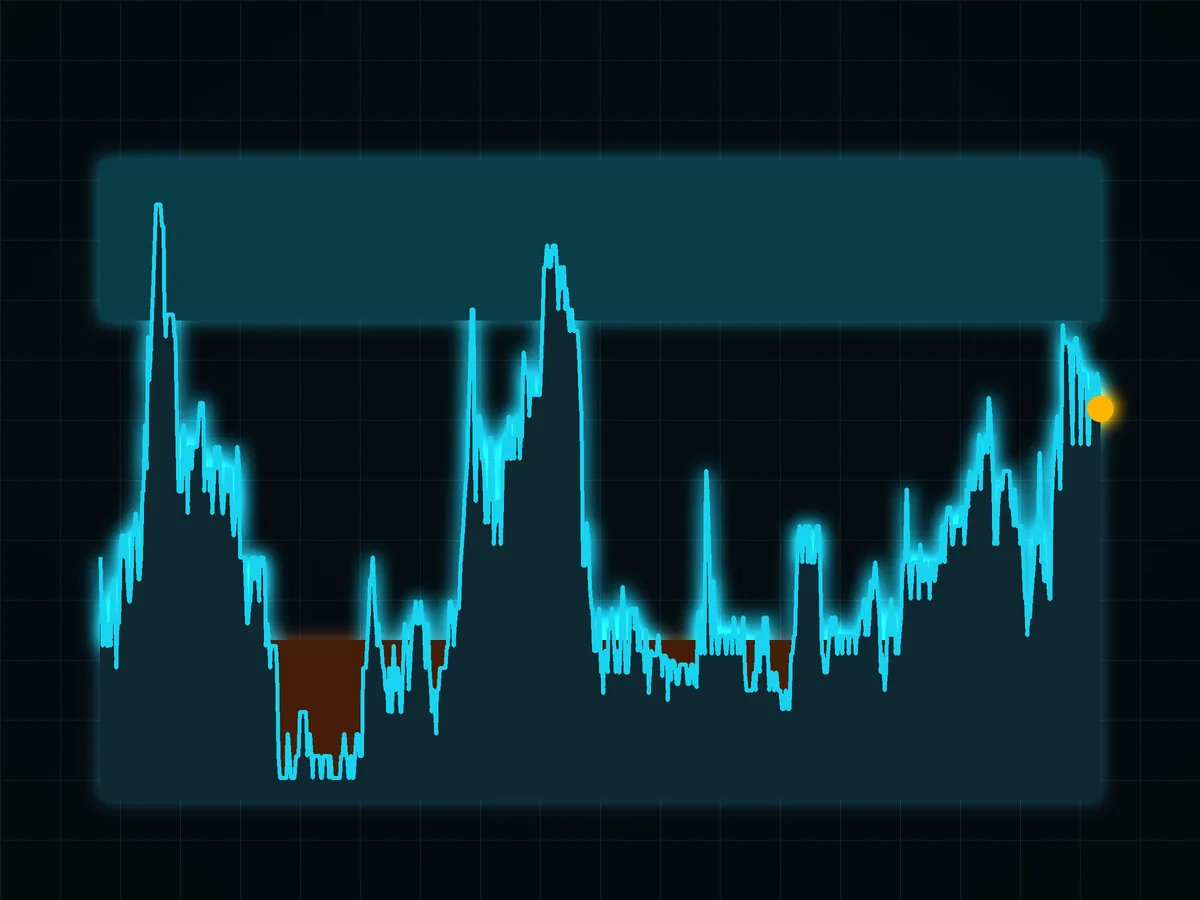
Price shows what the market did. The Fear and Greed Index tries to show what the market feels: a daily score from 0 (extreme fear) to 100 (extreme greed). On October 22, 2026 the crypto index stood at 68, Greed. It is useful as a check on your own emotions, but our look at more than 3,000 days of data shows that the popular "buy fear, sell greed" rule works far less neatly than it sounds.
01What goes into the number#
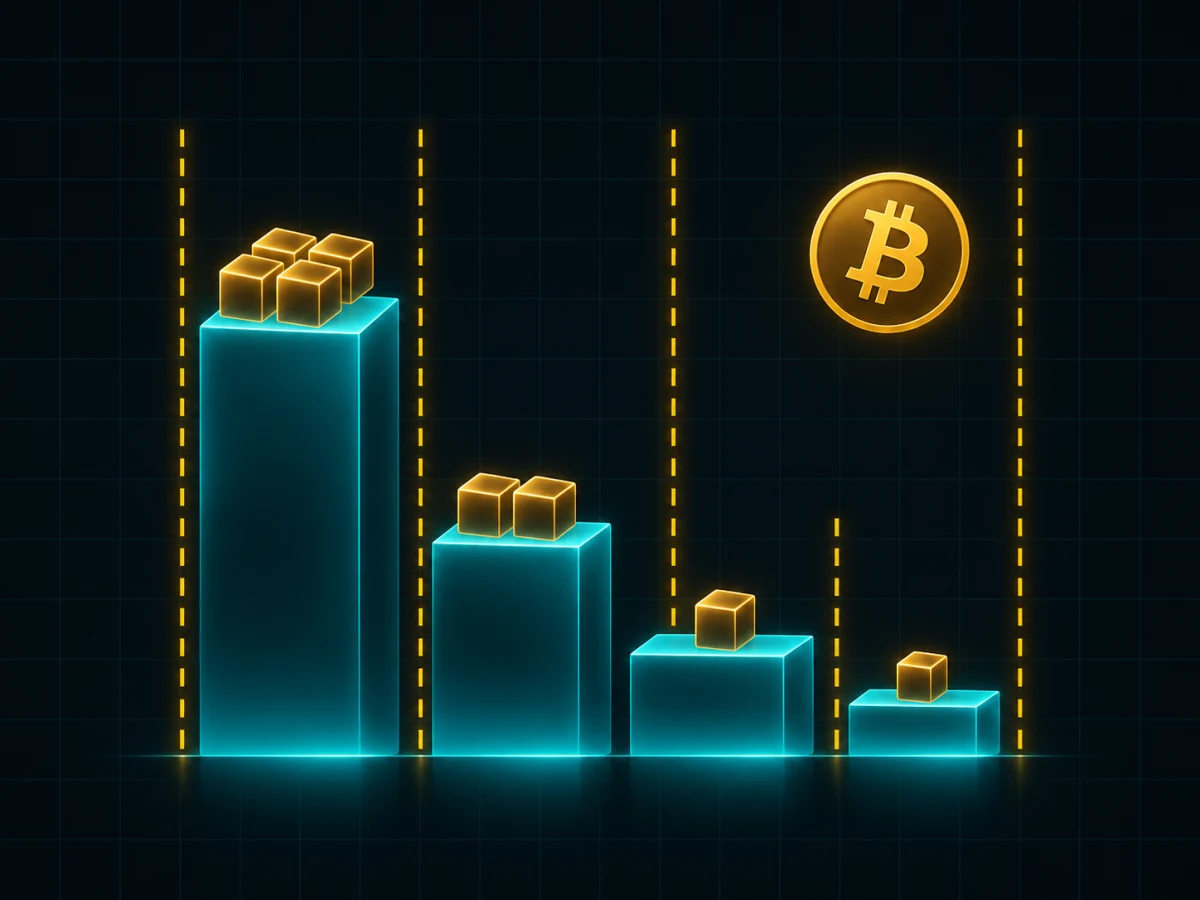
The best-known crypto version is published daily by Alternative.me. It blends several inputs into one score:
| Input | Weight | What it captures |
|---|---|---|
| Volatility | 25% | Current Bitcoin volatility and drawdowns against 30- and 90-day averages |
| Market momentum and volume | 25% | Buying pressure on rising volume |
| Social media | 15% | Activity and engagement around crypto topics |
| Surveys | 15% | Weekly polls, currently paused |
| Bitcoin dominance | 10% | Money hiding in Bitcoin often means caution |
| Search trends | 10% | What people search for around Bitcoin |
There is a separate, unrelated index for US stocks published by CNN. This guide is about the crypto one.
The index does not predict anything by itself. It aggregates crowd behavior, so its extremes mean that "everyone" has already done the same thing.
02How to read the scale#
- 0-24, extreme fear: panic, heavy selling, "it's over".
- 25-44, fear: caution, money moving to cash.
- 45-55, neutral: no strong emotion either way.
- 56-74, greed: growing appetite for risk, the crowd is buying.
- 75-100, extreme greed: euphoria and fear of missing out.
03What 8 years of data actually show#
The textbook idea is contrarian: be greedy when others are fearful and careful when others are greedy. We tested it. We took every daily reading from February 2018 to October 22, 2026, 3,182 days in total, and checked where Bitcoin's daily close was 30 and 90 days later.
| Index reading | Days in sample (30-day window) | BTC higher 30 days later | Median 30-day change | BTC higher 90 days later | Median 90-day change |
|---|---|---|---|---|---|
| 20 or below | 421 | 62% | +3.2% | 48% | -2.0% |
| 21 to 79 | 2,566 | 52% | +0.7% | 54% | +3.2% |
| 80 or above | 165 | 72% | +14.8% | 70% | +29.9% |
| All days | 3,152 | 54% | +1.6% | 54% | +3.4% |
Three things stand out:
- Extreme fear was a mildly better-than-average 30-day entry, and no better at 90 days. Fear marks where the crowd is. It does not mark the bottom. Readings of 5, the lowest on record, came both in August 2019 and in February 2026.
- Extreme greed did not reliably precede a drop. In this sample, readings of 80 and above were usually followed by more gains, because they tend to show up in the middle of strong trends.
- Extremes last. The longest unbroken stretch of extreme greed (75 or above) ran for 77 days. Anyone shorting "because the index says greed" would have been early for weeks.
04Where people go wrong with it#
Treating it as a timer. The index says where the emotion is, not when to act. Entries come from price and structure, with a stop where the idea is wrong.
Shorting greed. As the data shows, greed can keep running. Extreme readings are a reason to tighten risk, not a reason to bet against the trend.
Using it alone. It works best next to other context: the trend, key levels, Bitcoin dominance and the funding rate, which shows what leveraged traders are actually paying to stay in.
05How to actually use it#
The most honest use of the index is as a mirror for your own head:
- When you feel the urge to buy into euphoria and the index says extreme greed, that is a moment to slow down, check your plan and size the position by the rules in risk per trade, not by excitement.
- When everything is red and frightening and the index sits in extreme fear, that is a moment not to panic with the crowd, and to look at your plan calmly.
It will not tell you when to buy. It can stop you from becoming part of the crowd that buys high and sells low.
FAQ#
What is the crypto Fear and Greed Index?
What was the index on October 22, 2026?
Should I buy when the index shows extreme fear?
Does extreme greed mean a crash is coming?
How often is the index updated?

DoberInvest on Telegram
Questions about this guide?Ask in the English channel. That is also where we post charts, the levels we watch and what would change our mind. A system, not signals, and no profit promises.
This guide explains how the mechanics work; what you do with them is your own decision. Trading can lose you money, and leverage makes losses bigger and faster. 18+

Founder of DoberInvest, in the market since 2018. Teaches a system, not signals.